- Today
- Past 24 hours
- Past 3 days
- Past 7 days
- Past 30 days
- Past 3 months
- Past 12 months
The time periods shown vary based on your cleanup interval settings, so you might not see all of the time periods listed above.
Video Resources
Watch this short video to learn more about the Dashboard options.Key Metrics
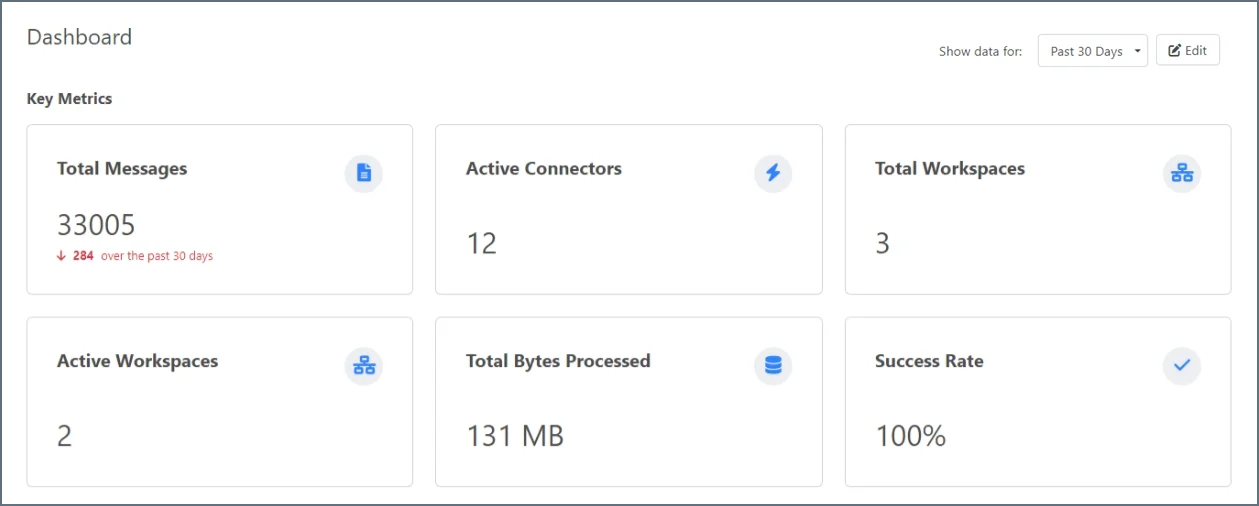
- Total Messages
- Total Transactions
- Total Transactions Sent
- Total Transactions Received
- Total MFT Transactions
- Total EDI Messages
- Total Errors
- Total Send Errors
- Total Receive Errors
- Total Connectors
- Active Connectors
- Total Workspaces
- Active Workspaces
- Total Bytes Processed
- Average Bytes Processed
- Success Rate
- Failure Rate
- SLA Violations
- At Risk SLAs
Trends
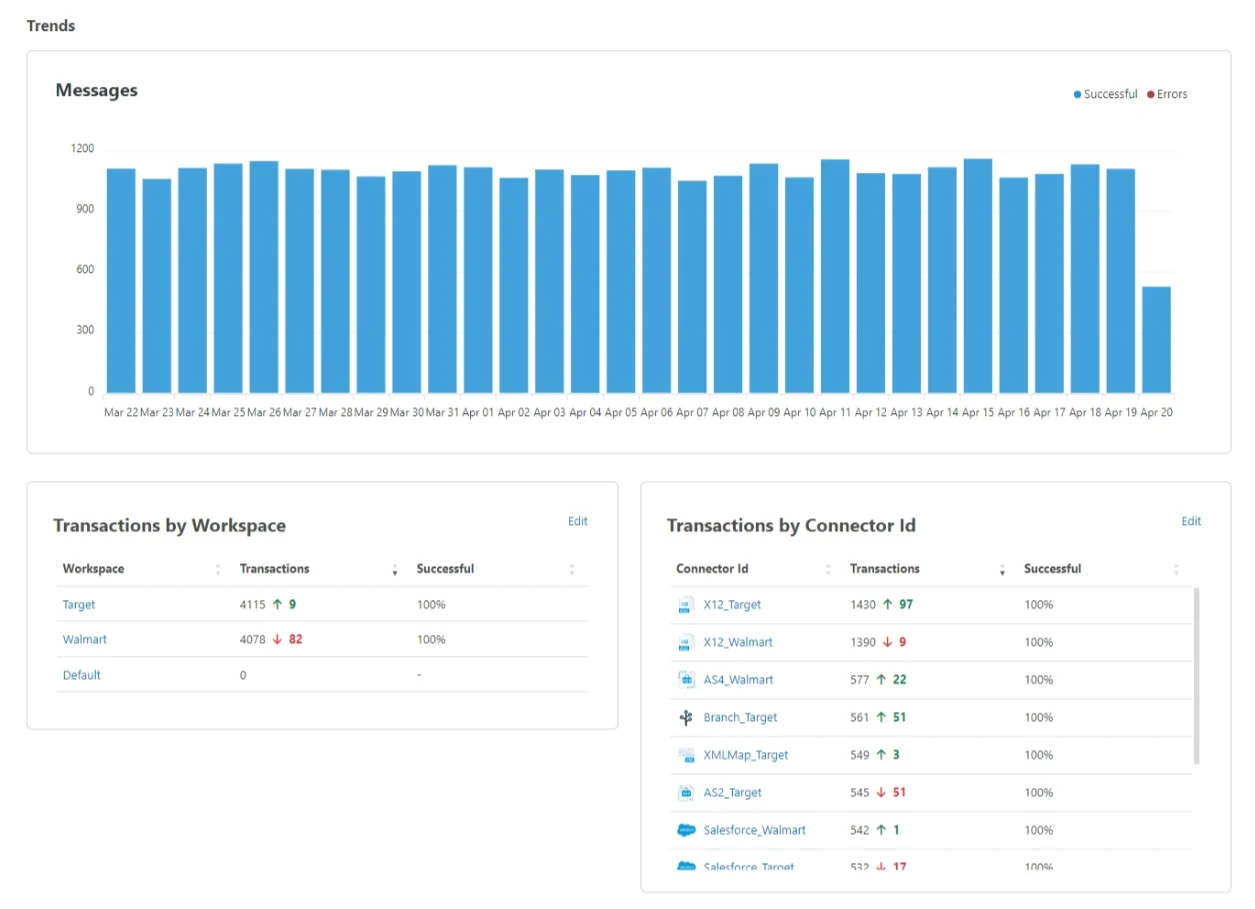
Messages
This chart is a snapshot of the number of messages received over your chosen time period. It shows you how many were successful, and how many caused an error. Hover over the bars in the chart to see counts of the two statuses.Transactions by Workspace
This table gives you a breakdown of the number of messages in each workspace, and it compares them to the previous time period. This lets you observe trends in the volume of messages that each workspace is processing. You can Edit this widget to select which workspaces to display. By default it includes all workspaces.Transactions by Connector Id
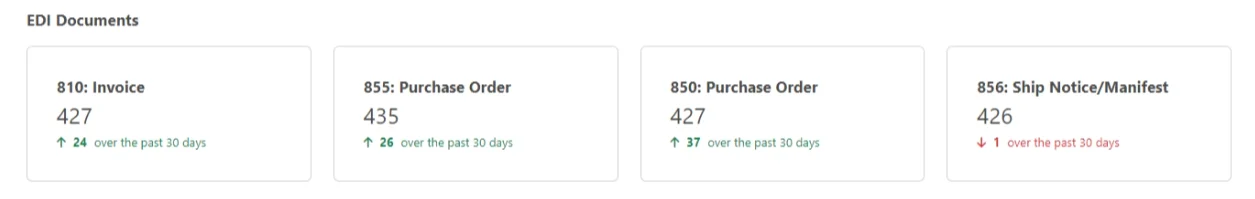
This table gives you a breakdown of the number of messages each connector has processed. It also compares them to the previous time period so you can observe trends in the volume of messages each connector is processing. You can Edit this widget to select which connectors to display. By default it includes all connectors.EDI Documents
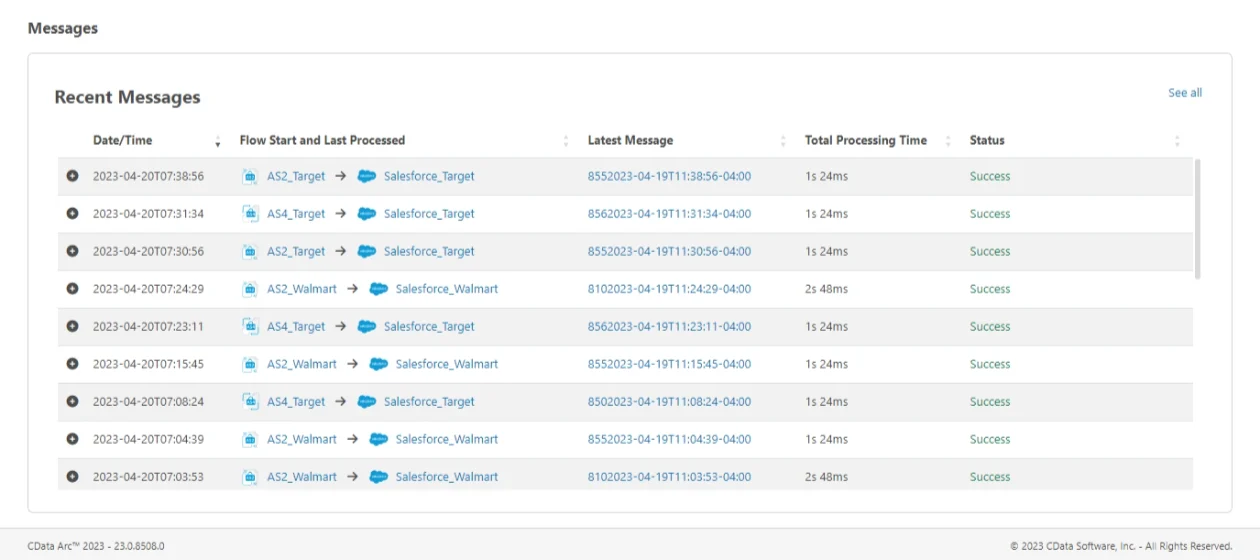
Recent Messages