> ## Documentation Index
> Fetch the complete documentation index at: https://docs.arc.cdata.com/llms.txt
> Use this file to discover all available pages before exploring further.
# Reports
> How to create, schedule, and manage reports for data trends in CData Arc.
export const siteNameShort = "Arc";
export const siteName = "CData Arc";
The **Reports** page allows you to create reports about data trends in {siteName}. For example, you can generate a report about file processing times to see which steps in a flow take the longest to complete, or you can use a report to discover which connectors in a flow produce the most errors.
## Availability
Reports are only available in the {siteNameShort} Enterprise package. For information about {siteNameShort} packages and licensing, see the Pricing & Packages page.
Only admin users can create, run, and delete reports. Standard and Support users can view the results of reports that have been run, but they cannot create new reports or run existing reports to generate new results. For more information about user roles, see [User Roles](./settings/user-roles).
## Creating and Managing Reports
If you have not created a report, the **Reports** page displays a welcome message and an **Add Report** button. If you have created at least one report, the page lists your reports.
### Creating a Report
Follow these steps to create a report:
1. Click **Add Report**.
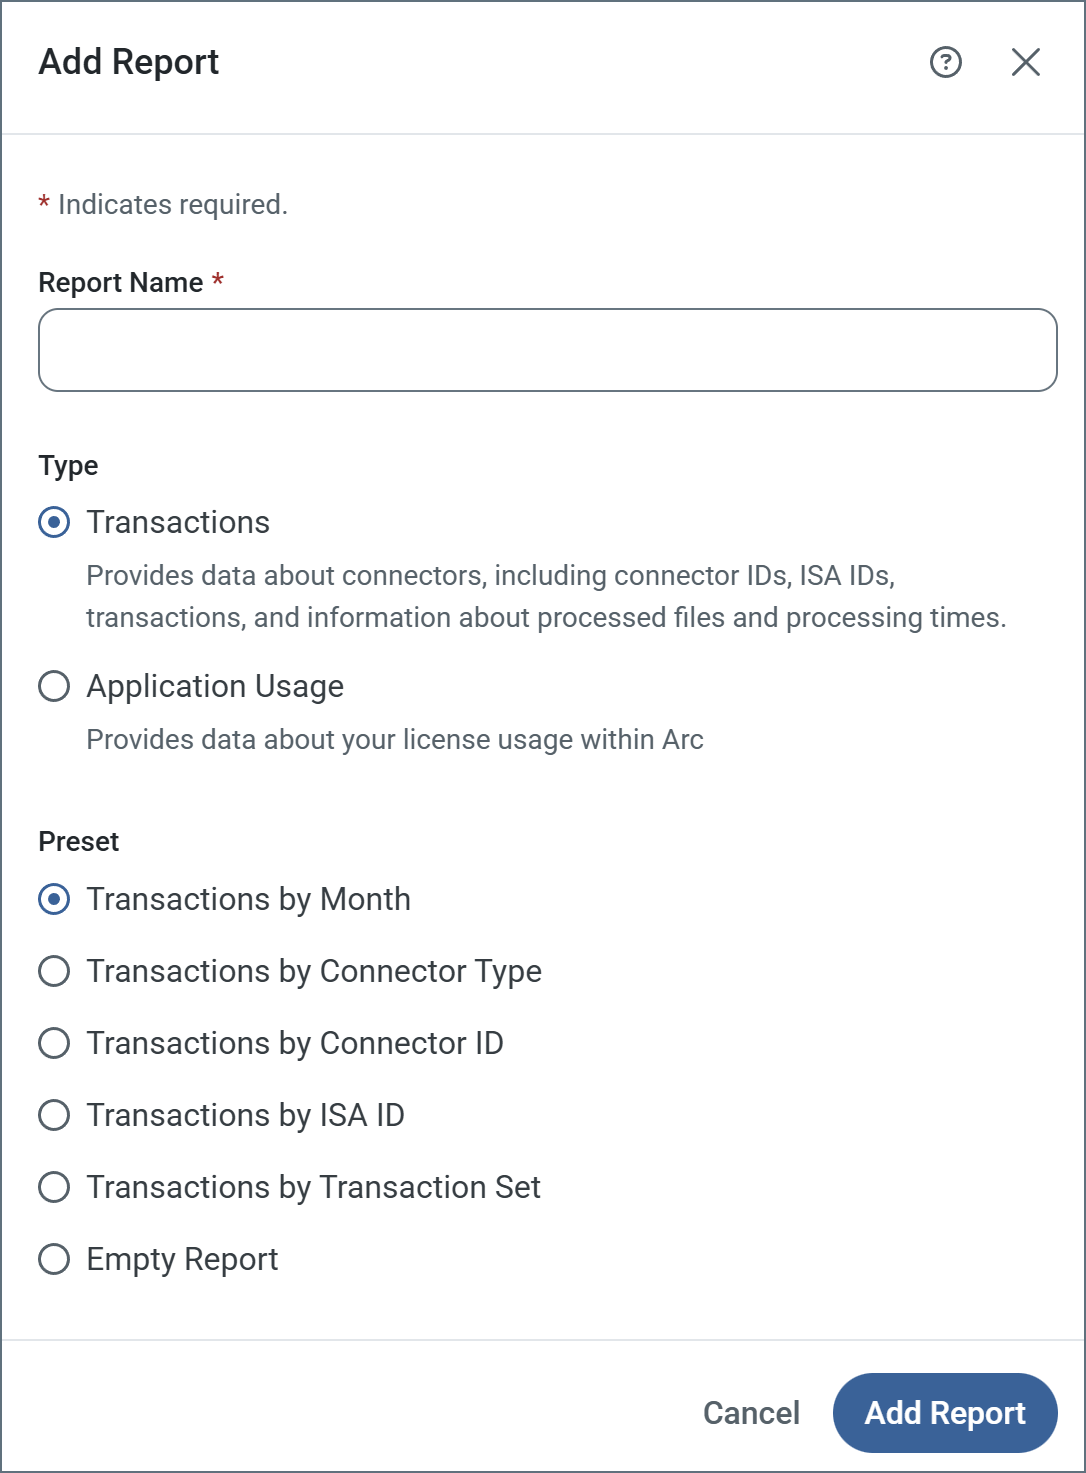 2. Enter a **Report Name**.
3. Select the report **Type**. You cannot change this value after the report is created.
* **Transactions**—provides data about connectors, including connector Ids, ISA Ids, transactions, and information about processed files.
* **Application Usage**—provides data about your {siteNameShort} license usage.
4. Select an option from the **Presets** list to serve as the template for your report. The template provides a functional base to build your report on, and you can modify the contents of your report as needed.
The **Transactions by ISA Id** and **Transactions by Transaction Set** preset reports rely on header tracking, and they only produce results if header tracking is enabled in the appropriate connectors in the flow. See [X12](../../connectors/x12#advanced-settings) and [EDIFACT](../../connectors/edifact#advanced-settings) for more information about these headers.
5. Click **Add Report** to open the [report view](#report-view) where you can build and run the report.
### Accessing Generated Reports
If you have created at least one report, the **Reports** page displays a searchable, sortable list of all of your reports.
2. Enter a **Report Name**.
3. Select the report **Type**. You cannot change this value after the report is created.
* **Transactions**—provides data about connectors, including connector Ids, ISA Ids, transactions, and information about processed files.
* **Application Usage**—provides data about your {siteNameShort} license usage.
4. Select an option from the **Presets** list to serve as the template for your report. The template provides a functional base to build your report on, and you can modify the contents of your report as needed.
The **Transactions by ISA Id** and **Transactions by Transaction Set** preset reports rely on header tracking, and they only produce results if header tracking is enabled in the appropriate connectors in the flow. See [X12](../../connectors/x12#advanced-settings) and [EDIFACT](../../connectors/edifact#advanced-settings) for more information about these headers.
5. Click **Add Report** to open the [report view](#report-view) where you can build and run the report.
### Accessing Generated Reports
If you have created at least one report, the **Reports** page displays a searchable, sortable list of all of your reports.
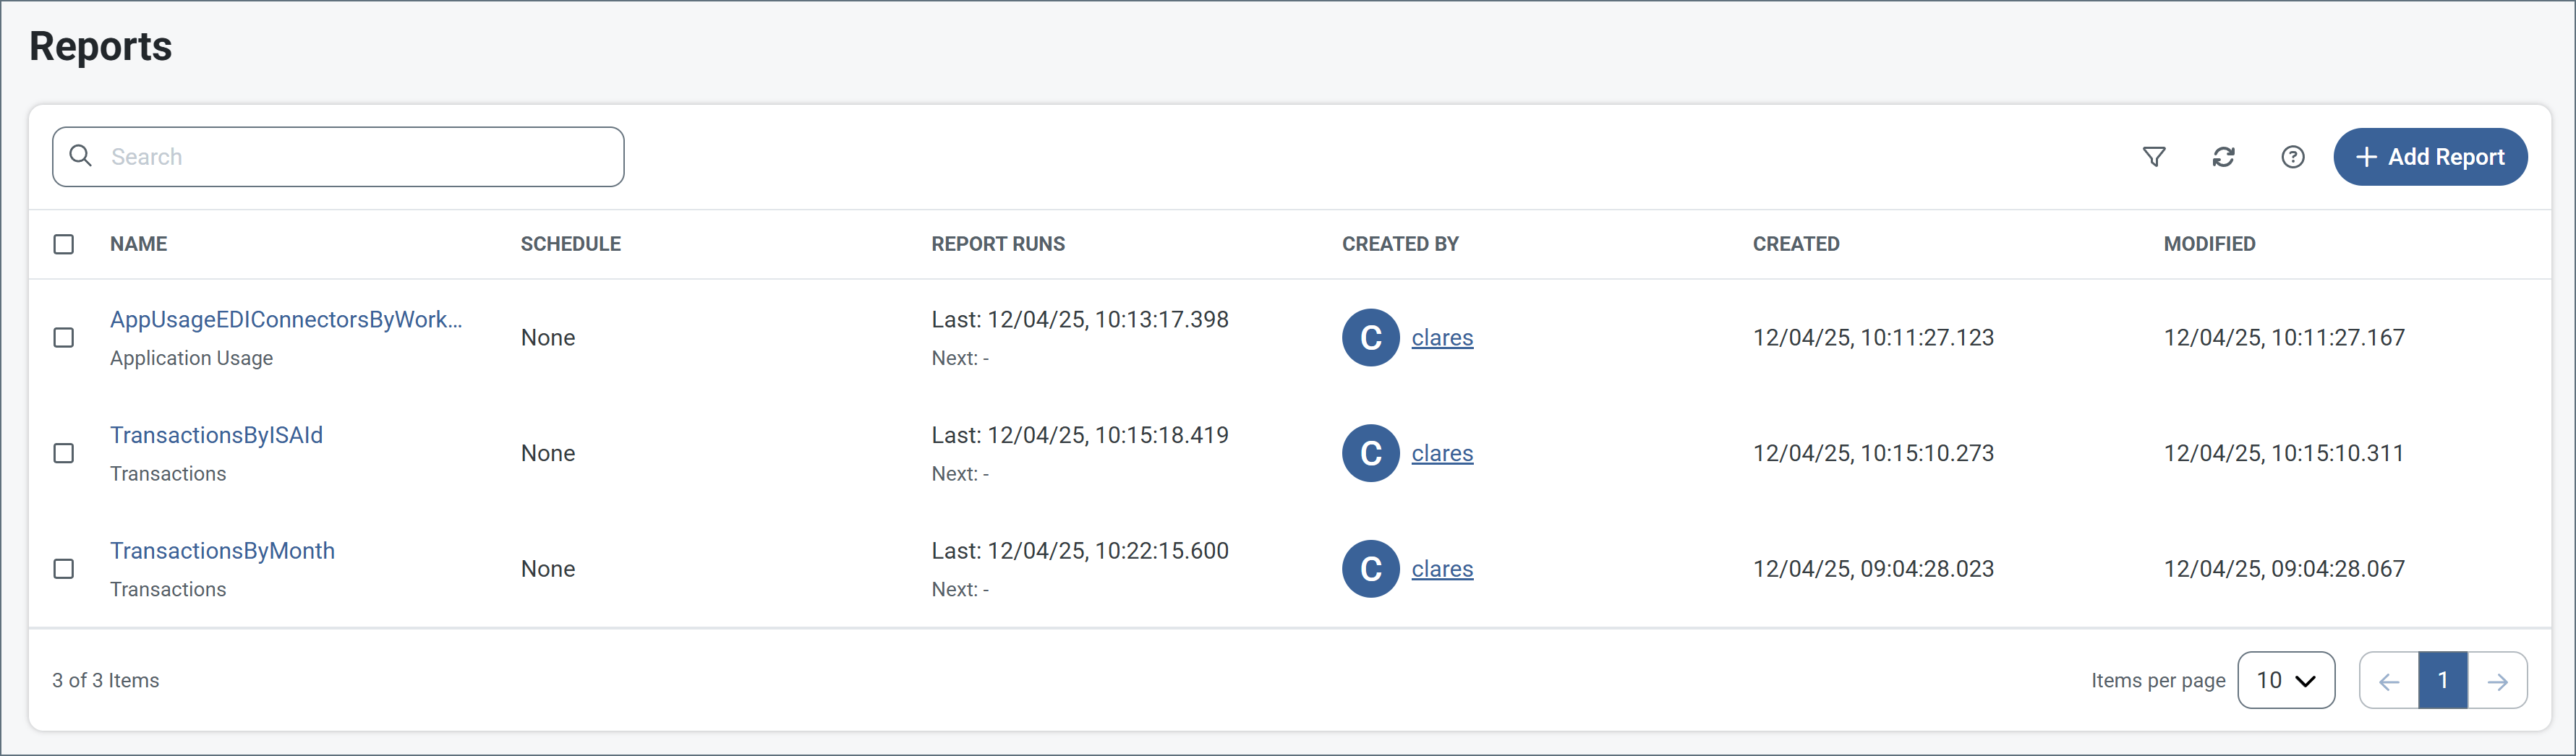 * Click a report in the list to open the [report view](#report-view) for that report. From here you can modify and run the report.
* To delete reports, select the checkbox next to each report, click **Remove**, then confirm whether to delete the selected report(s). To delete an individual report, click the ellipses and choose **Remove**.
## Report View
When you open a report, the report view consists of two sections:
* The main [report view](#main-report-view) on the left shows the results of the most recent report run and includes the **Export** button.
* The settings pane on the right consists of the [Builder](#builder-tab) and [Scheduler](#scheduler-tab) tabs. These allow you to build, run, and schedule the report.
### Builder Tab
The **Builder** tab allows you to set the report parameters and run it. The parameters are:
| Category | Description |
| ------------ | ------------------------------------------------------------------------------------------------------------------------------------------------------------------------------------------------------------------------------------------------------------ |
| Time Period | The period of time that the report covers. Selecting **Custom Date Range** adds two fields for the start date and end date for the report. The default is *All-time*. |
| Columns | The information that the report generates. You can include as many columns as you need. See [Columns](#columns) for a list of available options. |
| Group by | The fields to use when grouping results in the report. Each selected option receives its own column in the report. See [Group By](#group-by) for a list of available options. |
| Filters | Options for narrowing the report results. See [Filters](#filters) for a list of available options. |
| Data Summary | Options for summarizing the values of each column. Enabling at least one option creates a **Subtotal** row for each report section and a **Grand Total** row at the bottom of the report. See [Data Summary](#data-summary) for a list of available options. |
Transaction reports all include any [tracked headers](./activity#tracked-headers) you have defined in {siteNameShort}. They appear in the lists of available column, group by, and filter options, and you can select them just like any other item.
#### Columns
The following options are available for **Columns**:
| Column | Description | Transactions Reports | Application Usage Reports |
| --------------------- | ------------------------------------------------------------------------- | :------------------: | :-----------------------: |
| Workspace | Workspace (such as *Default*) | ✓ | ✓ |
| Connector Category | Category (such as *Core*, *EDI*, or *MFT*) | | ✓ |
| Connector Id | Connector Id (such as *XMLMap1*) | ✓ | ✓ |
| Connector Type | Type (such as *XML Map*) | ✓ | ✓ |
| Year | Year of the transaction | ✓ | |
| Quarter | Quarter of the transaction | ✓ | |
| Month | Month of the transaction | ✓ | |
| Week | Week of the transaction | ✓ | |
| Sender ISA Id | The ISA Id of the sender of an EDI document | ✓ | |
| Receiver ISA Id | The ISA Id of the recipient of an EDI document | ✓ | |
| Transaction Set | The standardized identification code for the type of document transmitted | ✓ | |
| All Transactions | Total number of sent and received transactions | ✓ | |
| Transactions Sent | Number of transactions sent | ✓ | |
| Transactions Received | Number of transactions received | ✓ | |
| Total Processing Time | Processing time (in milliseconds) of all transactions | ✓ | |
| Total File Size | Size of all files sent and received | ✓ | |
| Successful | Number of successful transactions | ✓ | |
| Error | Number of transaction errors | ✓ | |
| Warning | Number of transaction warnings | ✓ | |
#### Group By
The following options are available for **Group by**:
| Group by | Transactions Reports | Application Usage Reports |
| ------------------ | :------------------: | :-----------------------: |
| Workspace | ✓ | ✓ |
| Connector Category | | ✓ |
| Connector Id | ✓ | |
| Connector Type | ✓ | ✓ |
| Year | ✓ | |
| Quarter | ✓ | |
| Month | ✓ | |
| Week | ✓ | |
| Sender ISA Id | ✓ | |
| Receiver ISA Id | ✓ | |
| Transaction Set | ✓ | |
#### Filters
The following options are available for **Filters**:
| Filters | Transactions Reports | Application Usage Reports |
| ------------------ | :------------------: | :-----------------------: |
| Workspace | ✓ | ✓ |
| Connector Category | | ✓ |
| Connector Id | ✓ | ✓ |
| Connector Type | ✓ | ✓ |
| Status | ✓ | |
| Sender ISA Id | ✓ | |
| Receiver ISA Id | ✓ | |
| Transaction Set | ✓ | |
#### Data Summary
The following options are available for **Data Summary**:
| Summary | Transactions Reports | Application Usage Reports |
| ------- | :------------------: | :-----------------------: |
| Total | ✓ | ✓ |
| Average | ✓ | |
| Minimum | ✓ | |
| Maximum | ✓ | |
### Scheduler Tab
The **Scheduler** tab allows you to set an automatic schedule for running the current report. This can be useful if you have reports you are interested in viewing regularly, without having to log into the application to get the data.
By default, the **Frequency** is set to *None*, which means that the report does not run unless you manually execute it. To set the report to run automatically, set the **Frequency** to *Monthly*, *Weekly*, or *Daily* and configure the settings as needed. After configuring the schedule, click **Save** or **Apply** at the bottom of the **Scheduler** tab to save your changes. You can also click the **Revert Changes** icon to revert all changes to the last saved schedule values.
If you have a schedule set, you can still manually run the report at any time by clicking **Run** on the **Builder** tab.
#### Email Report
If you configure a schedule and select **Email Report**, the application automatically sends an email with the report results when the scheduler runs. When this feature is enabled, two fields appear:
* **Subject** specifies the subject of the automated report email.
* **Recipients** accepts a comma-separated list of email addresses for the report recipients.
The email feature uses the same email server configuration that is specified on the [Alerts](./settings/settings-page#alerts) page.
### Main Report View
The main report view displays the results generated the last time the current report was run. You can sort each column of the report in ascending or descending order.
* Click a report in the list to open the [report view](#report-view) for that report. From here you can modify and run the report.
* To delete reports, select the checkbox next to each report, click **Remove**, then confirm whether to delete the selected report(s). To delete an individual report, click the ellipses and choose **Remove**.
## Report View
When you open a report, the report view consists of two sections:
* The main [report view](#main-report-view) on the left shows the results of the most recent report run and includes the **Export** button.
* The settings pane on the right consists of the [Builder](#builder-tab) and [Scheduler](#scheduler-tab) tabs. These allow you to build, run, and schedule the report.
### Builder Tab
The **Builder** tab allows you to set the report parameters and run it. The parameters are:
| Category | Description |
| ------------ | ------------------------------------------------------------------------------------------------------------------------------------------------------------------------------------------------------------------------------------------------------------ |
| Time Period | The period of time that the report covers. Selecting **Custom Date Range** adds two fields for the start date and end date for the report. The default is *All-time*. |
| Columns | The information that the report generates. You can include as many columns as you need. See [Columns](#columns) for a list of available options. |
| Group by | The fields to use when grouping results in the report. Each selected option receives its own column in the report. See [Group By](#group-by) for a list of available options. |
| Filters | Options for narrowing the report results. See [Filters](#filters) for a list of available options. |
| Data Summary | Options for summarizing the values of each column. Enabling at least one option creates a **Subtotal** row for each report section and a **Grand Total** row at the bottom of the report. See [Data Summary](#data-summary) for a list of available options. |
Transaction reports all include any [tracked headers](./activity#tracked-headers) you have defined in {siteNameShort}. They appear in the lists of available column, group by, and filter options, and you can select them just like any other item.
#### Columns
The following options are available for **Columns**:
| Column | Description | Transactions Reports | Application Usage Reports |
| --------------------- | ------------------------------------------------------------------------- | :------------------: | :-----------------------: |
| Workspace | Workspace (such as *Default*) | ✓ | ✓ |
| Connector Category | Category (such as *Core*, *EDI*, or *MFT*) | | ✓ |
| Connector Id | Connector Id (such as *XMLMap1*) | ✓ | ✓ |
| Connector Type | Type (such as *XML Map*) | ✓ | ✓ |
| Year | Year of the transaction | ✓ | |
| Quarter | Quarter of the transaction | ✓ | |
| Month | Month of the transaction | ✓ | |
| Week | Week of the transaction | ✓ | |
| Sender ISA Id | The ISA Id of the sender of an EDI document | ✓ | |
| Receiver ISA Id | The ISA Id of the recipient of an EDI document | ✓ | |
| Transaction Set | The standardized identification code for the type of document transmitted | ✓ | |
| All Transactions | Total number of sent and received transactions | ✓ | |
| Transactions Sent | Number of transactions sent | ✓ | |
| Transactions Received | Number of transactions received | ✓ | |
| Total Processing Time | Processing time (in milliseconds) of all transactions | ✓ | |
| Total File Size | Size of all files sent and received | ✓ | |
| Successful | Number of successful transactions | ✓ | |
| Error | Number of transaction errors | ✓ | |
| Warning | Number of transaction warnings | ✓ | |
#### Group By
The following options are available for **Group by**:
| Group by | Transactions Reports | Application Usage Reports |
| ------------------ | :------------------: | :-----------------------: |
| Workspace | ✓ | ✓ |
| Connector Category | | ✓ |
| Connector Id | ✓ | |
| Connector Type | ✓ | ✓ |
| Year | ✓ | |
| Quarter | ✓ | |
| Month | ✓ | |
| Week | ✓ | |
| Sender ISA Id | ✓ | |
| Receiver ISA Id | ✓ | |
| Transaction Set | ✓ | |
#### Filters
The following options are available for **Filters**:
| Filters | Transactions Reports | Application Usage Reports |
| ------------------ | :------------------: | :-----------------------: |
| Workspace | ✓ | ✓ |
| Connector Category | | ✓ |
| Connector Id | ✓ | ✓ |
| Connector Type | ✓ | ✓ |
| Status | ✓ | |
| Sender ISA Id | ✓ | |
| Receiver ISA Id | ✓ | |
| Transaction Set | ✓ | |
#### Data Summary
The following options are available for **Data Summary**:
| Summary | Transactions Reports | Application Usage Reports |
| ------- | :------------------: | :-----------------------: |
| Total | ✓ | ✓ |
| Average | ✓ | |
| Minimum | ✓ | |
| Maximum | ✓ | |
### Scheduler Tab
The **Scheduler** tab allows you to set an automatic schedule for running the current report. This can be useful if you have reports you are interested in viewing regularly, without having to log into the application to get the data.
By default, the **Frequency** is set to *None*, which means that the report does not run unless you manually execute it. To set the report to run automatically, set the **Frequency** to *Monthly*, *Weekly*, or *Daily* and configure the settings as needed. After configuring the schedule, click **Save** or **Apply** at the bottom of the **Scheduler** tab to save your changes. You can also click the **Revert Changes** icon to revert all changes to the last saved schedule values.
If you have a schedule set, you can still manually run the report at any time by clicking **Run** on the **Builder** tab.
#### Email Report
If you configure a schedule and select **Email Report**, the application automatically sends an email with the report results when the scheduler runs. When this feature is enabled, two fields appear:
* **Subject** specifies the subject of the automated report email.
* **Recipients** accepts a comma-separated list of email addresses for the report recipients.
The email feature uses the same email server configuration that is specified on the [Alerts](./settings/settings-page#alerts) page.
### Main Report View
The main report view displays the results generated the last time the current report was run. You can sort each column of the report in ascending or descending order.
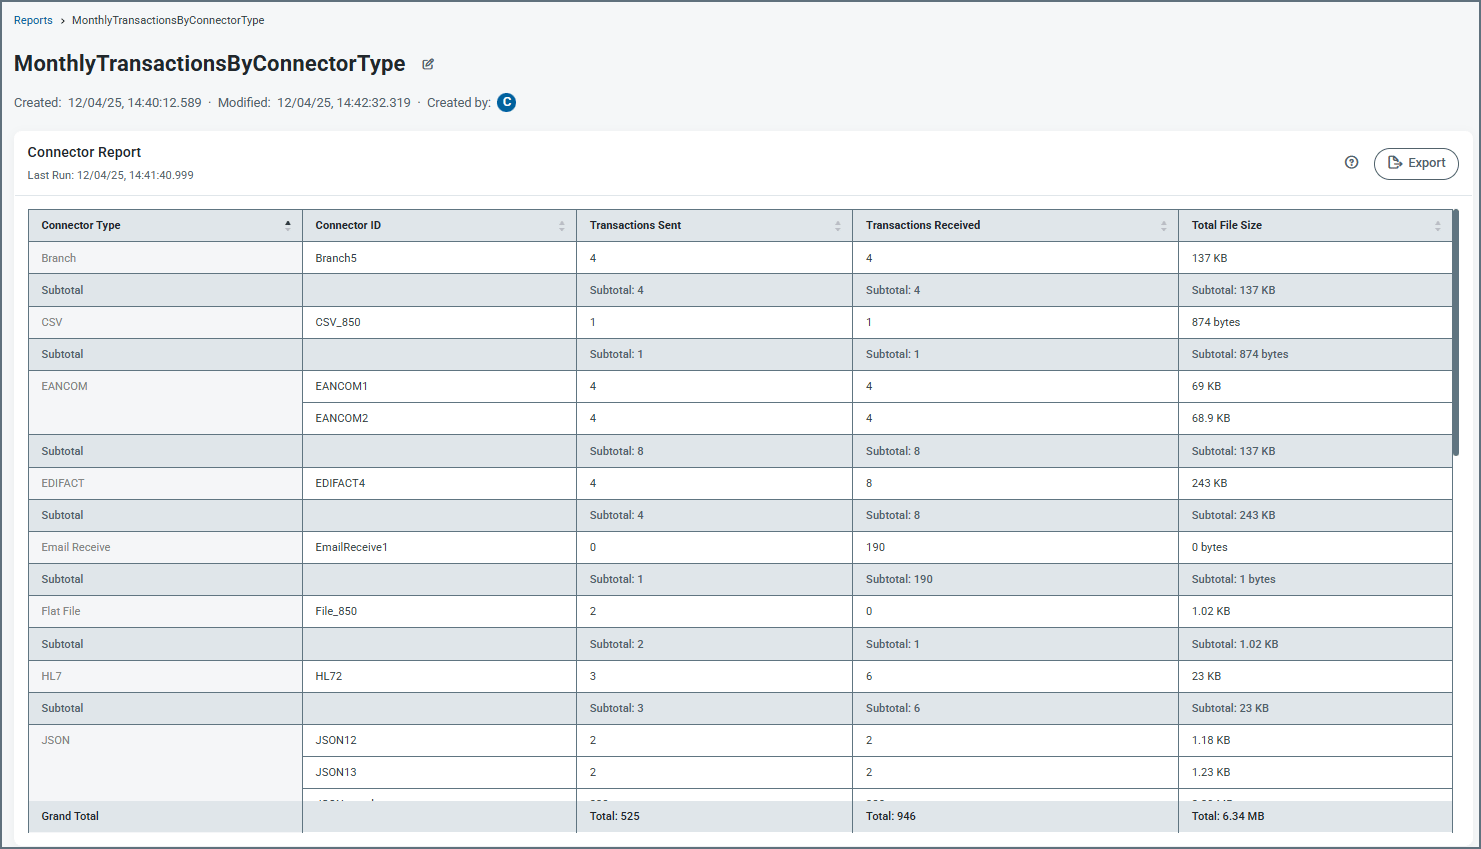 When you set a [Group by](#group-by) column in your report, the report results are automatically sorted by that column in descending order, as shown in the following image. If you try to sort by other columns in the table, nothing happens because the Group By always takes precedence.
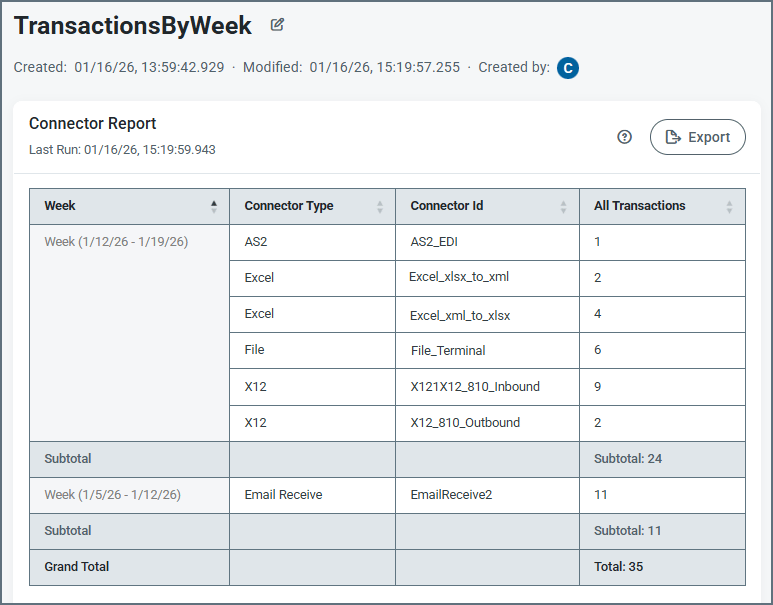 Above the report results, you can rename the report by clicking the tablet and pencil
  icon next to the report name.
* Click **Export** to export the most recent report results to a CSV file.
* Click **Save** to save all changes to the current report.
### Run, Save and Revert
At the bottom of the right-hand pane you always have three options:
* Click the **Revert Changes**
icon next to the report name.
* Click **Export** to export the most recent report results to a CSV file.
* Click **Save** to save all changes to the current report.
### Run, Save and Revert
At the bottom of the right-hand pane you always have three options:
* Click the **Revert Changes**  icon to revert all changes to the last saved version of the report.
* Click **Save** to **Save Changes** to the existing report or to **Save as a New Report**.
* Click **Run** to run the report with the current settings and display the results in the main report view area.
icon to revert all changes to the last saved version of the report.
* Click **Save** to **Save Changes** to the existing report or to **Save as a New Report**.
* Click **Run** to run the report with the current settings and display the results in the main report view area.