> ## Documentation Index
> Fetch the complete documentation index at: https://docs.arc.cdata.com/llms.txt
> Use this file to discover all available pages before exploring further.
# Configuring the Source Structure
> Define the source structure for outgoing EDI document workflows in CData Arc.
export const siteNameShort = "Arc";
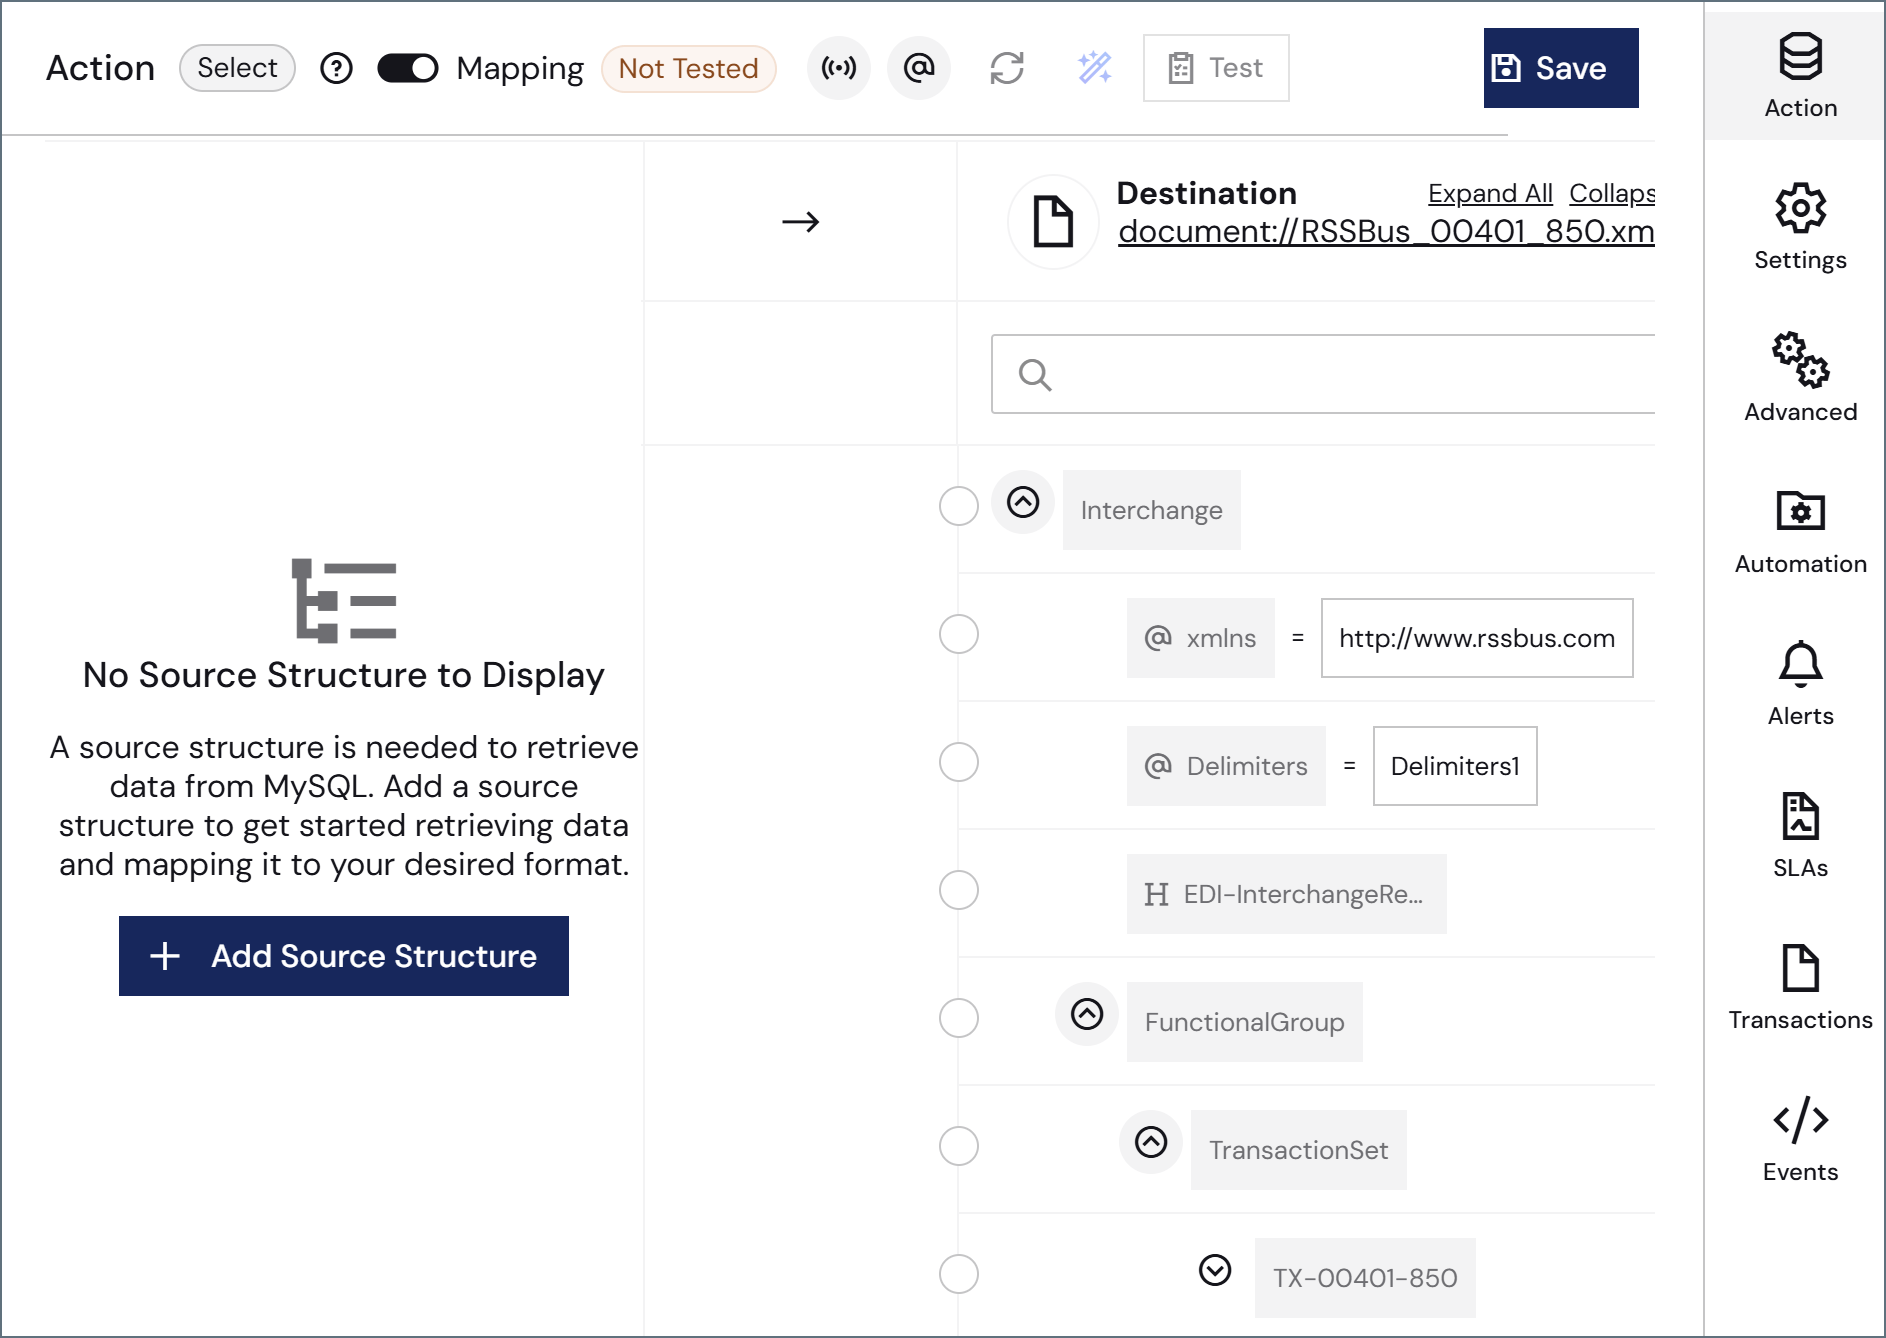
For outgoing document workflows, you must define a source structure that tells the connector which data to retrieve from your data source. The source structure is configured in the **Edit Source Structure** dialog, which you open by clicking **Add Source Structure** on the **Action** tab.
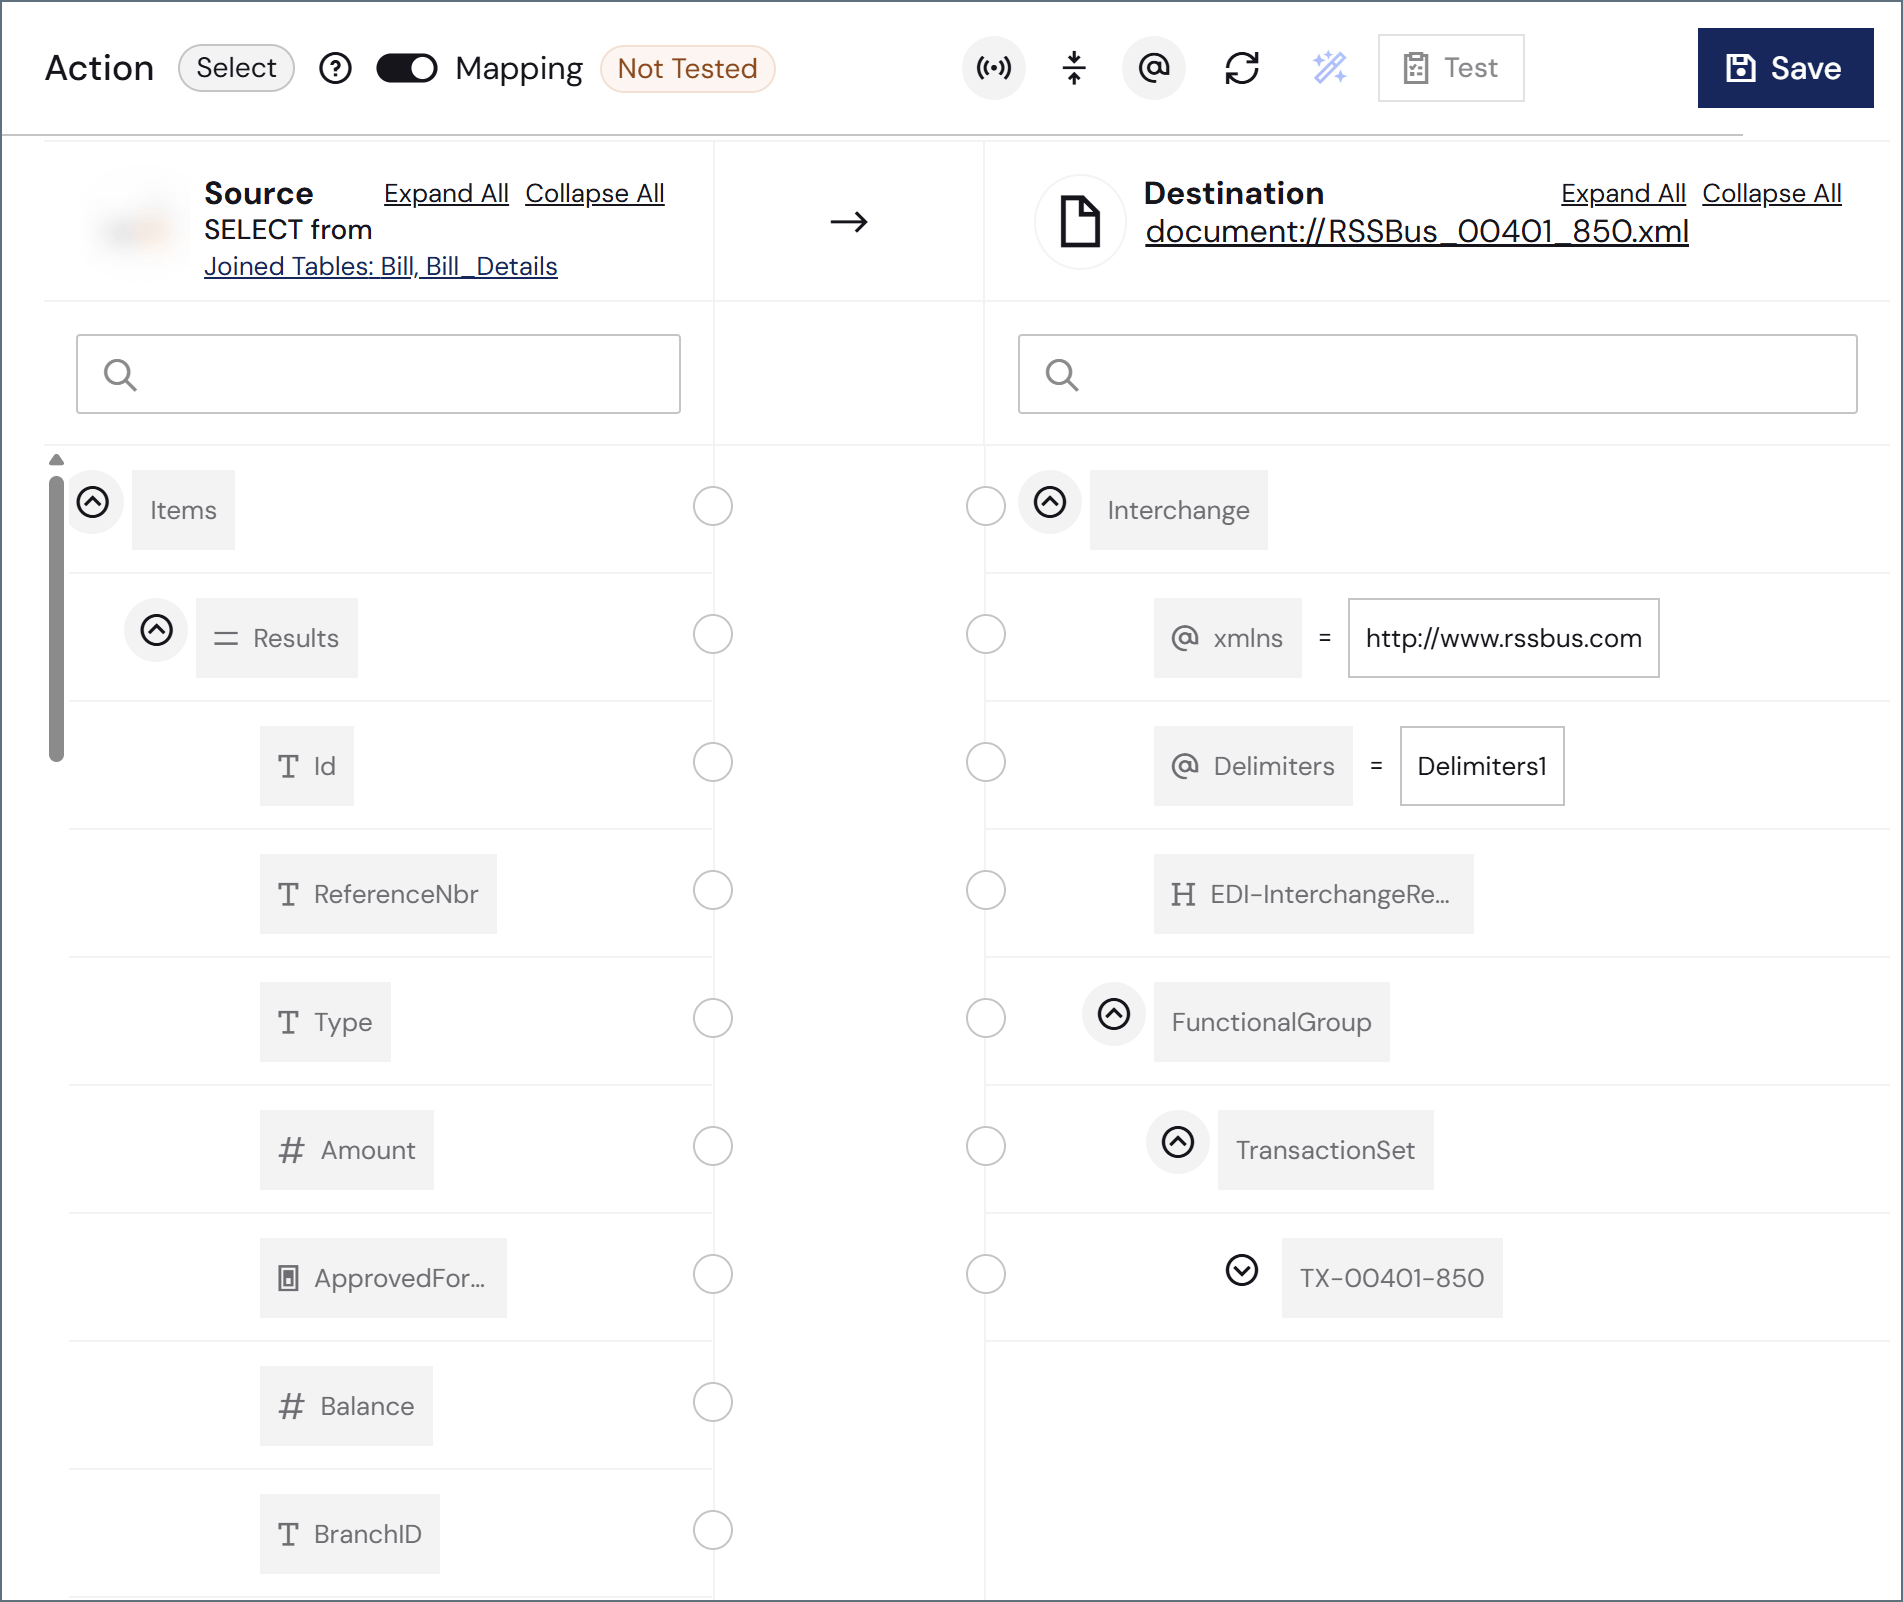
 Once you define the source structure, the source columns appear in the left pane of the mapping editor, ready to be mapped to the destination EDI document structure.
 ## Structure Type
When you open the **Edit Source Structure** dialog, choose a **Structure Type** from the dropdown. The structure type determines how the connector queries your data source.
* **Parent and Child Tables**: Queries tables using a parent-child hierarchy. You can add additional tables as child tables. This is described in [Parent and Child Tables](#parent-and-child-tables).
* **Joined Tables**: Issues a single JOIN query that combines data from two or more related tables. This is described in [Joined Tables](#joined-tables).
Joined Tables issues a single query to your data source, which is more efficient than the Parent and Child Tables approach for data sources that enforce API rate limits.
## Parent and Child Tables
When you select **Parent and Child Tables** as the structure type, use the dropdown to select a target table from your data source. Use the arrow to add child tables to your structure. When you have finished with your selections, click **Apply**.
### Results
After you click **Apply**, an **Items** node appears in the source pane of the mapping editor. To configure the columns and filters for your query, click the ellipsis on the table name node and choose **Table Settings**.
The **Edit \[table name] Settings** dialog opens with two tabs: **Columns** and **Filters**.
In the **Columns** tab, all columns from the selected table are listed. By default, all columns are selected. Uncheck a column to exclude it from the query output.
At the bottom of the **Columns** tab, use the **Order by** field to sort the output by a column, and choose **ASC** (ascending) or **DESC** (descending) order.
The **Filters** tab lets you add filters to limit the rows the connector selects. See [Filters](#filters) for more information.
### Options
The **Options** panel on the right side of the **Edit Source Structure** dialog contains settings that control how the connector processes records.
* **Use column \[x] for processing new or changed records**: Enables incremental processing so that the connector only selects rows that are new or changed since the last run.
* **Update \[column] with \[value] when rows are processed**: Updates a column with a specified value after each row is processed.
## Joined Tables
When you select **Joined Tables** as the structure type, the JOIN designer appears. Use the JOIN designer to define how tables in your data source relate to each other. The connector translates your configuration into a single JOIN query.
## Structure Type
When you open the **Edit Source Structure** dialog, choose a **Structure Type** from the dropdown. The structure type determines how the connector queries your data source.
* **Parent and Child Tables**: Queries tables using a parent-child hierarchy. You can add additional tables as child tables. This is described in [Parent and Child Tables](#parent-and-child-tables).
* **Joined Tables**: Issues a single JOIN query that combines data from two or more related tables. This is described in [Joined Tables](#joined-tables).
Joined Tables issues a single query to your data source, which is more efficient than the Parent and Child Tables approach for data sources that enforce API rate limits.
## Parent and Child Tables
When you select **Parent and Child Tables** as the structure type, use the dropdown to select a target table from your data source. Use the arrow to add child tables to your structure. When you have finished with your selections, click **Apply**.
### Results
After you click **Apply**, an **Items** node appears in the source pane of the mapping editor. To configure the columns and filters for your query, click the ellipsis on the table name node and choose **Table Settings**.
The **Edit \[table name] Settings** dialog opens with two tabs: **Columns** and **Filters**.
In the **Columns** tab, all columns from the selected table are listed. By default, all columns are selected. Uncheck a column to exclude it from the query output.
At the bottom of the **Columns** tab, use the **Order by** field to sort the output by a column, and choose **ASC** (ascending) or **DESC** (descending) order.
The **Filters** tab lets you add filters to limit the rows the connector selects. See [Filters](#filters) for more information.
### Options
The **Options** panel on the right side of the **Edit Source Structure** dialog contains settings that control how the connector processes records.
* **Use column \[x] for processing new or changed records**: Enables incremental processing so that the connector only selects rows that are new or changed since the last run.
* **Update \[column] with \[value] when rows are processed**: Updates a column with a specified value after each row is processed.
## Joined Tables
When you select **Joined Tables** as the structure type, the JOIN designer appears. Use the JOIN designer to define how tables in your data source relate to each other. The connector translates your configuration into a single JOIN query.
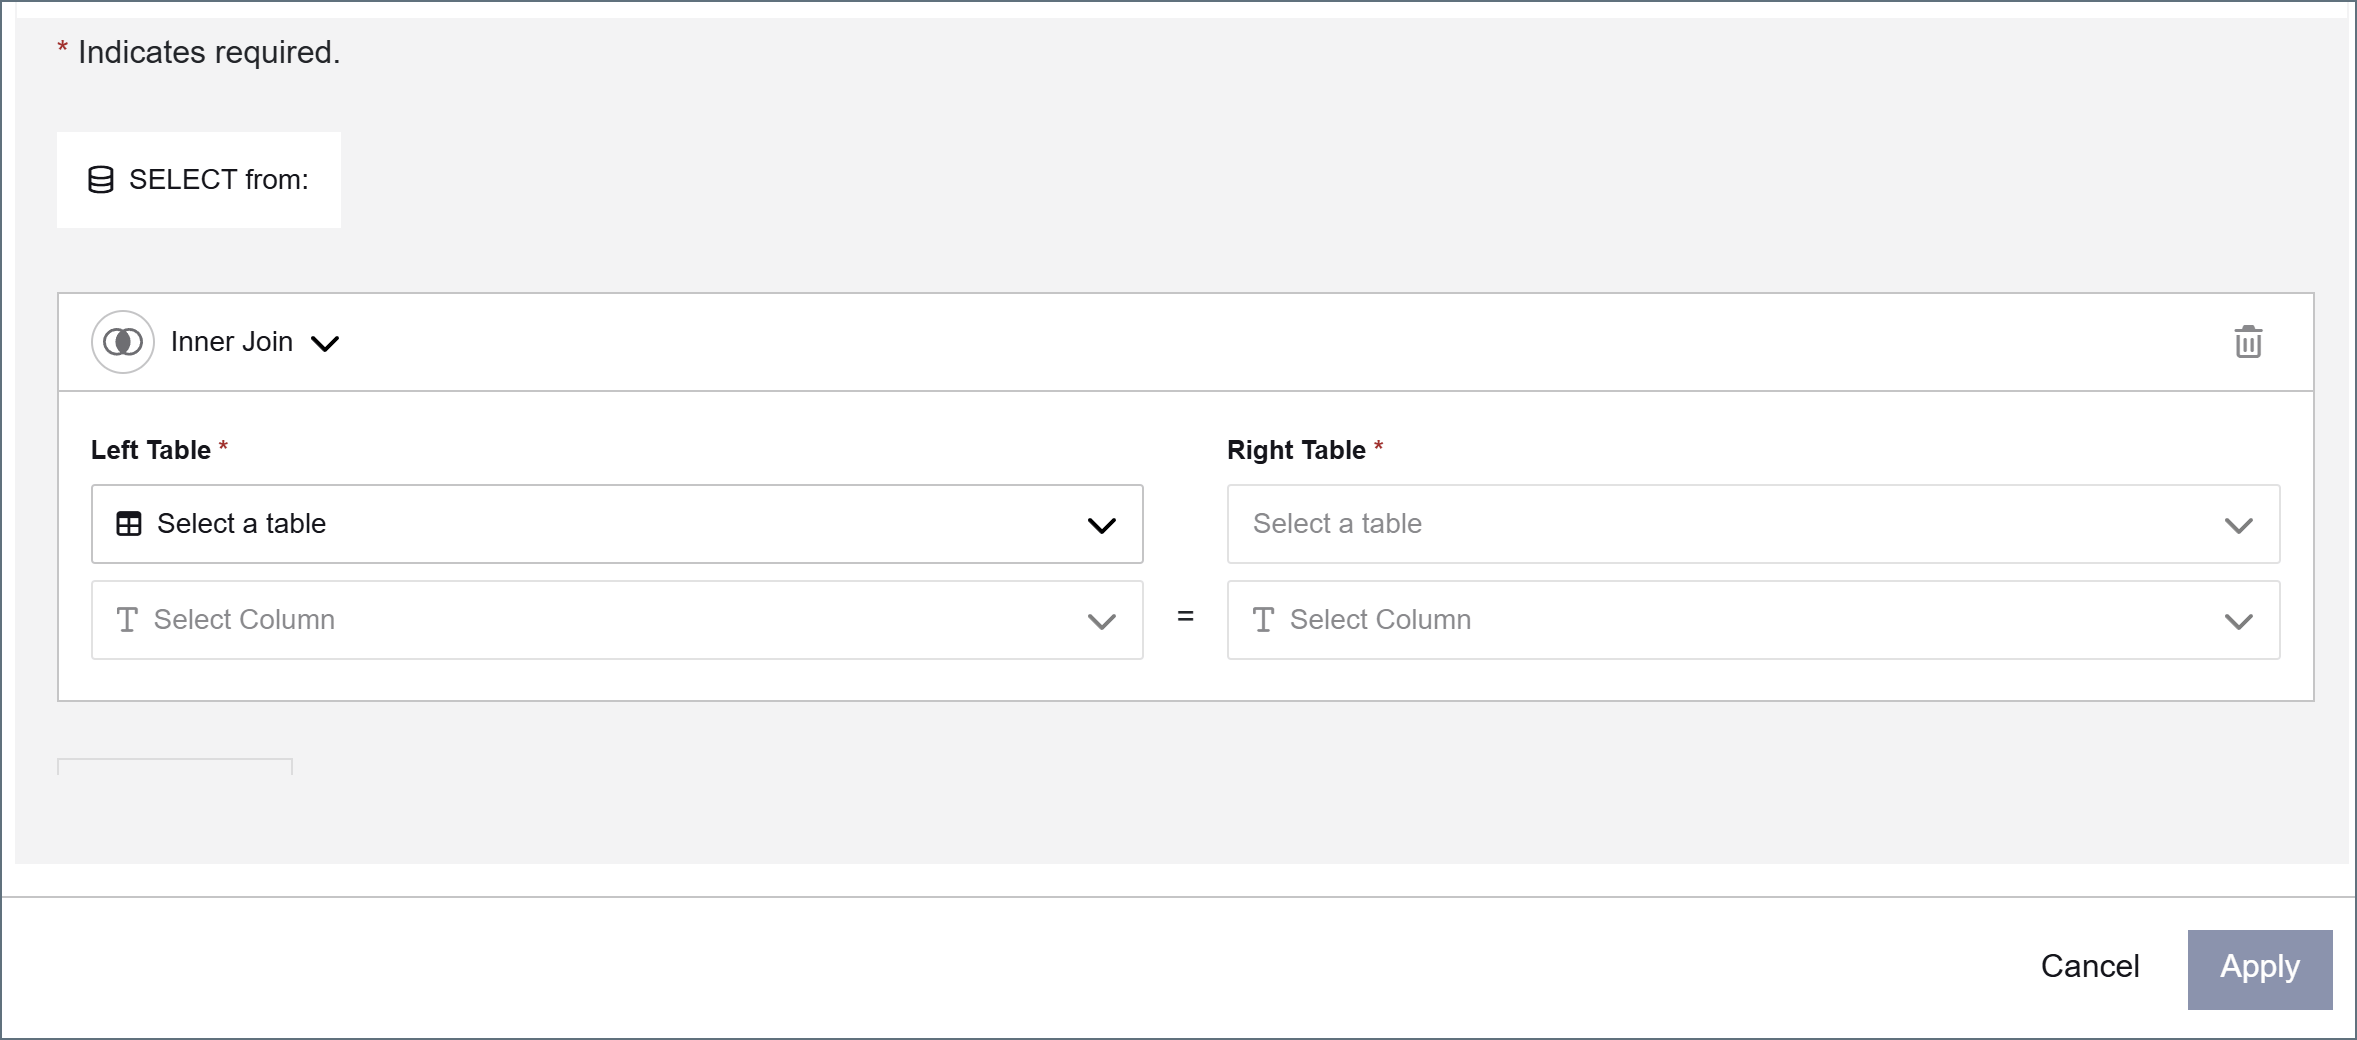 Each row in the JOIN designer represents one join relationship and contains the following fields:
* **Join Type**: The type of SQL join to perform. The available options depend on what your data source supports. Common options include **Inner Join**, **Left Join**, **Right Join**, and **Full Outer Join**.
* **Left Table**: The table on the left side of the join. The first join row's left table is the base table for the query.
* **Left Column**: The column from the left table to join on.
* **Right Table**: The related table on the right side of the join.
* **Right Column**: The column from the right table that matches the left column.
The following example joins a **Bill** table to a **Bill1** table on their shared **Id** column:
Each row in the JOIN designer represents one join relationship and contains the following fields:
* **Join Type**: The type of SQL join to perform. The available options depend on what your data source supports. Common options include **Inner Join**, **Left Join**, **Right Join**, and **Full Outer Join**.
* **Left Table**: The table on the left side of the join. The first join row's left table is the base table for the query.
* **Left Column**: The column from the left table to join on.
* **Right Table**: The related table on the right side of the join.
* **Right Column**: The column from the right table that matches the left column.
The following example joins a **Bill** table to a **Bill1** table on their shared **Id** column:
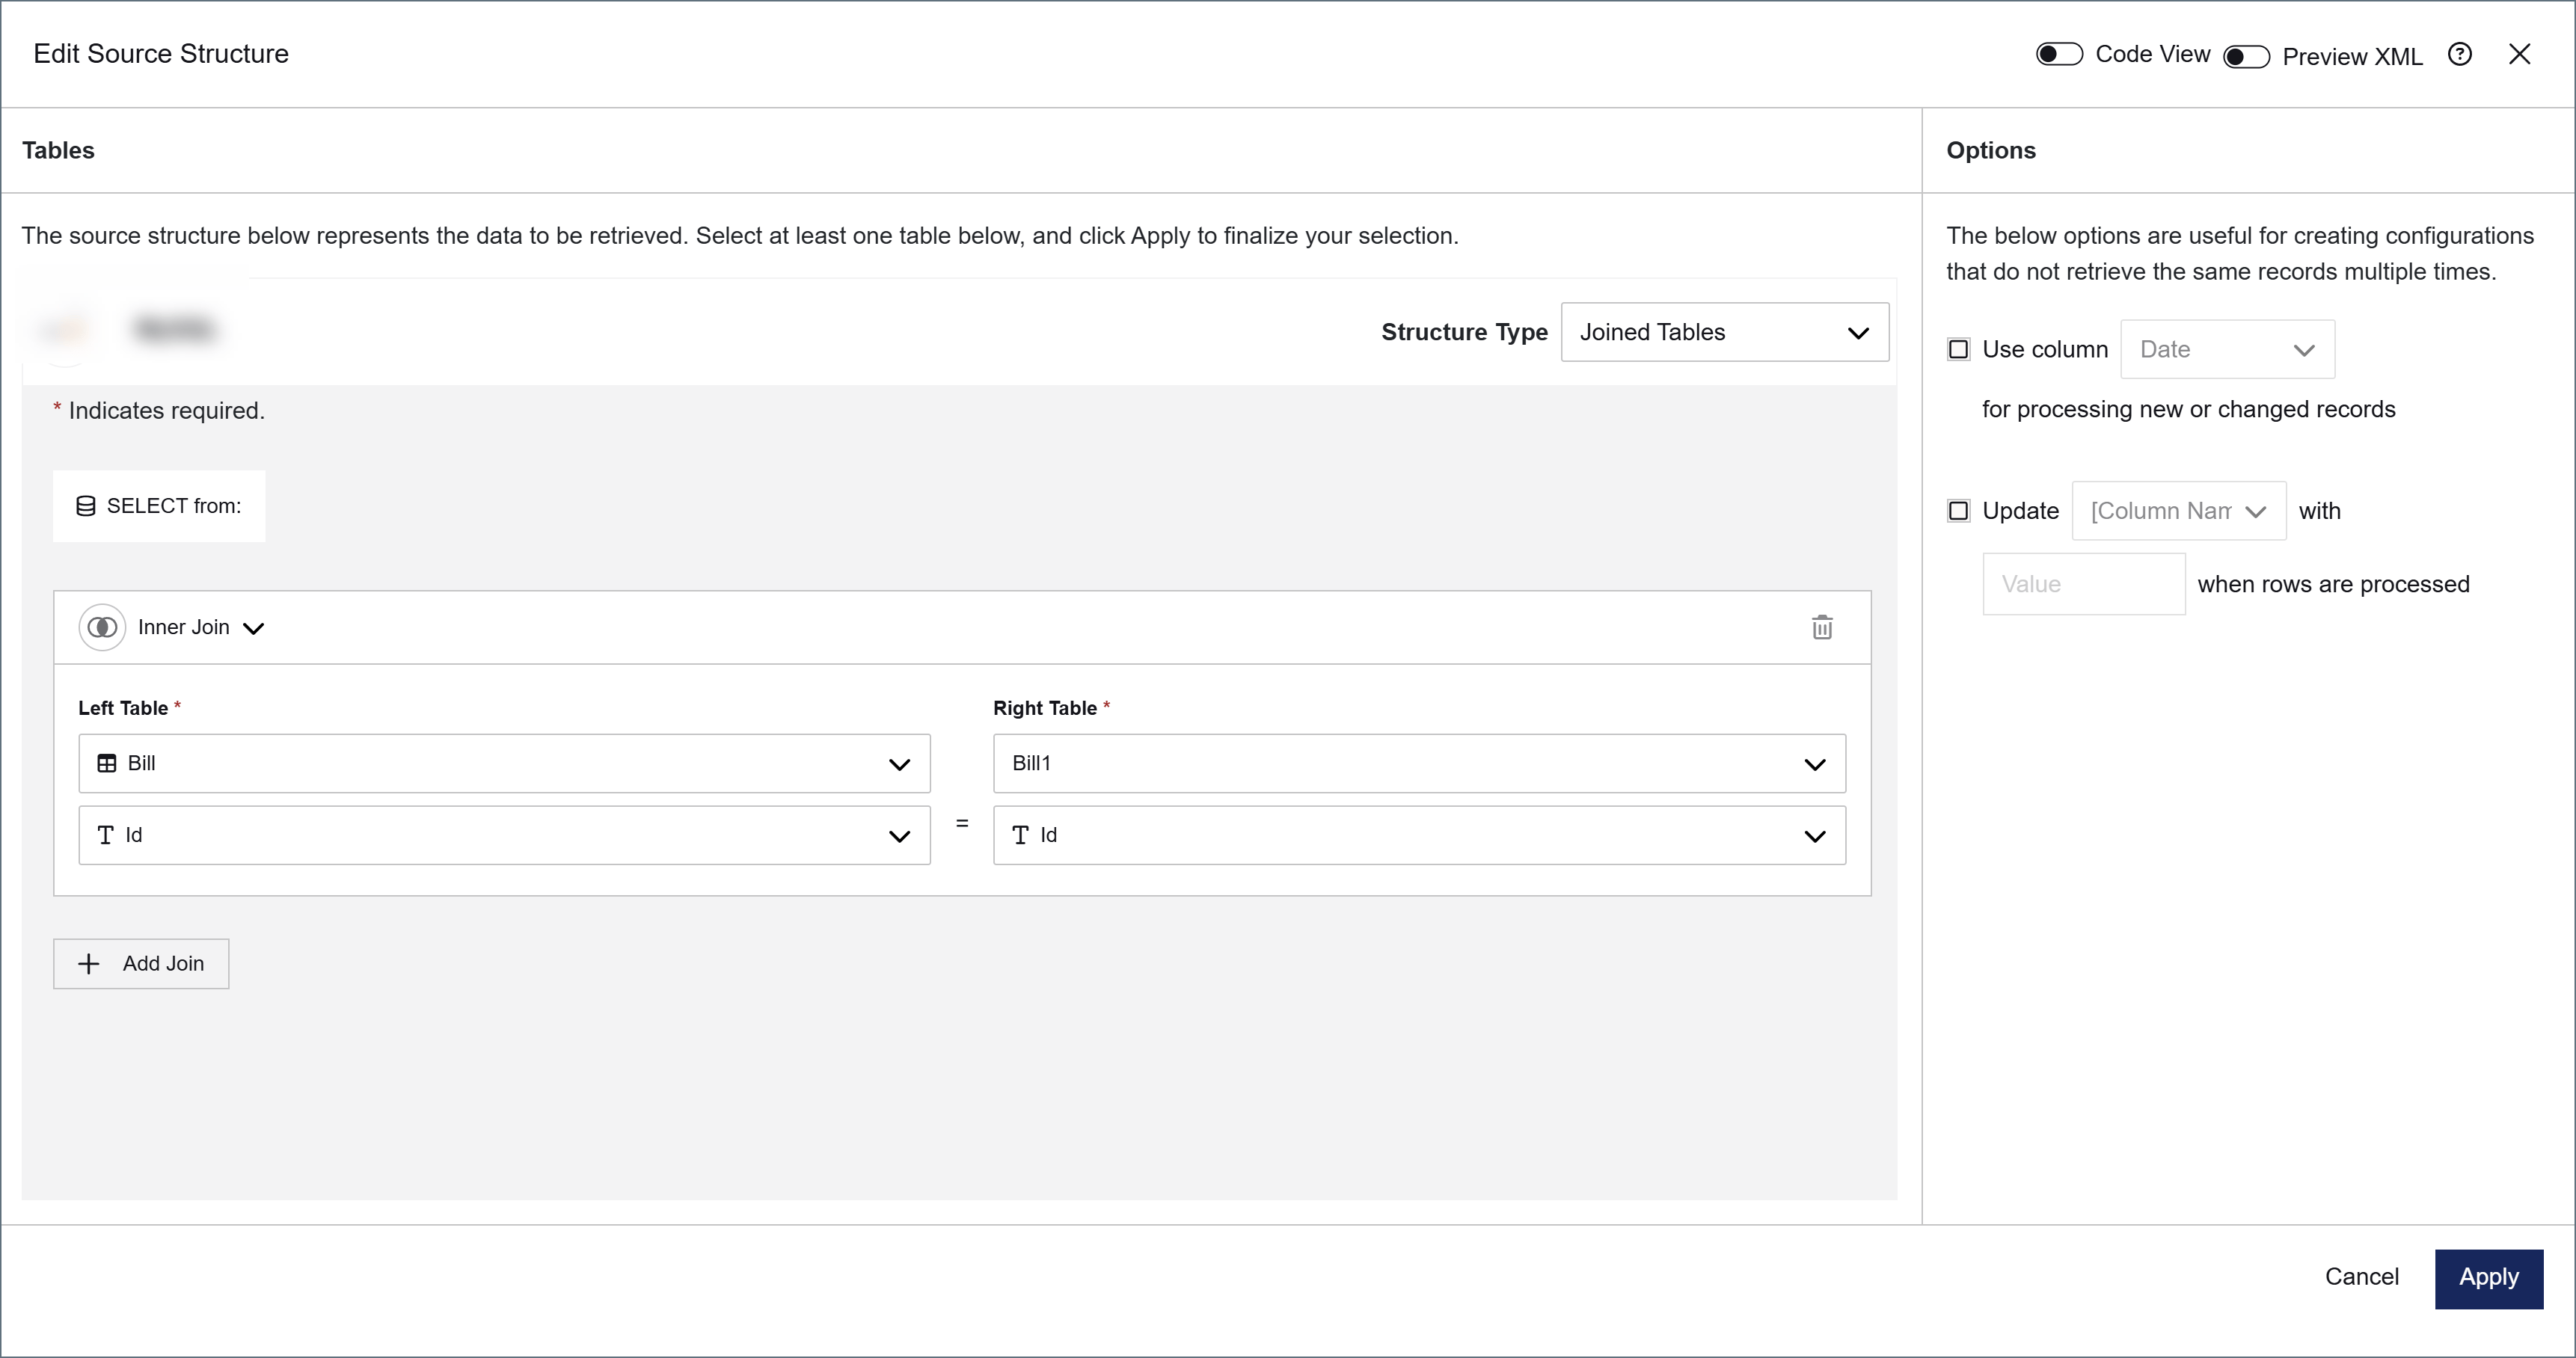 This produces a query equivalent to:
```sql theme={null}
SELECT ... FROM Bill INNER JOIN Bill1 ON Bill.Id = Bill1.Id
```
To join more than two tables, click **Add Join** to add another join row. Each additional row joins a new table to the result of the previous join.
When you are done configuring the join, click **Apply**.
### Results
After you click **Apply**, a **Results** node appears under the **Items** node in the source pane of the mapping editor. To configure the columns and filters for your join output, click the ellipsis on the Results node and choose **Results Settings**. The **Edit Results Settings** dialog opens with two tabs: **Columns** and **Filters**.
This produces a query equivalent to:
```sql theme={null}
SELECT ... FROM Bill INNER JOIN Bill1 ON Bill.Id = Bill1.Id
```
To join more than two tables, click **Add Join** to add another join row. Each additional row joins a new table to the result of the previous join.
When you are done configuring the join, click **Apply**.
### Results
After you click **Apply**, a **Results** node appears under the **Items** node in the source pane of the mapping editor. To configure the columns and filters for your join output, click the ellipsis on the Results node and choose **Results Settings**. The **Edit Results Settings** dialog opens with two tabs: **Columns** and **Filters**.
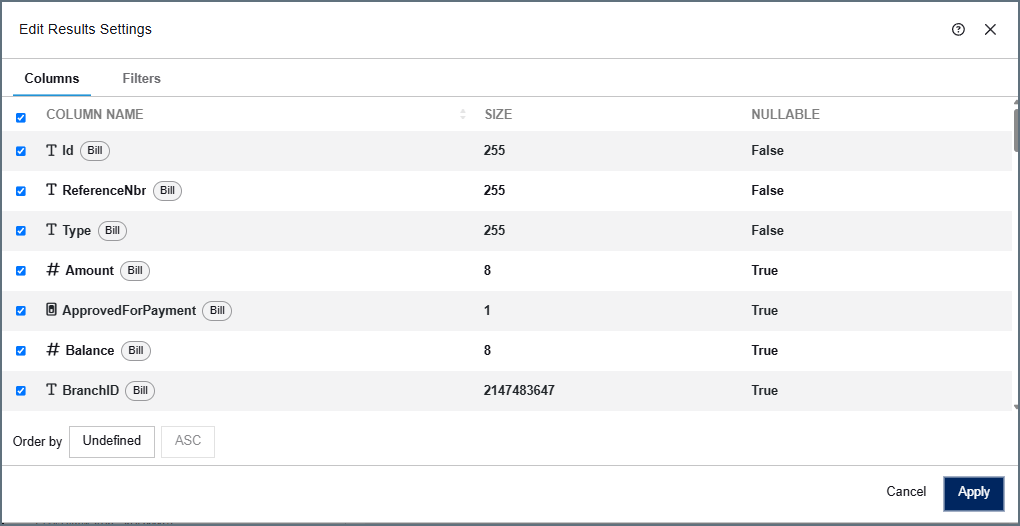 In the **Columns** tab, all columns from all joined tables are listed. Each column displays a tag indicating its source table. By default, all columns are selected. Uncheck a column to exclude it from the query output.
When two joined tables share a column name, the connector automatically prefixes the duplicate column with its table name to avoid collisions.
At the bottom of the **Columns** tab, use the **Order by** field to sort the output by a column, and choose **ASC** (ascending) or **DESC** (descending) order.
The **Filters** tab lets you add filters to limit the rows the connector selects. See [Filters](#filters) for more information.
### Options
The **Options** panel on the right side of the **Edit Source Structure** dialog contains settings that control how the connector processes records.
* **Use column \[x] for processing new or changed records**: Enables incremental processing so that the connector only selects rows that are new or changed since the last run. In a Joined Tables configuration, this column must come from the base (leftmost) table. Columns from joined tables are not available for this setting.
* **Update \[column] with \[value] when rows are processed**: Updates a column with a specified value after each row is processed.
You can also preview the output structure or view the underlying XML configuration by toggling **Preview XML** or **Code View** at the top of the **Edit Source Structure** dialog.
## Filters
You can optionally add filters to limit the data the connector selects. In the settings dialog, click the **Filters** tab to configure filters.
You do not need to apply a filter to your data if it does not suit your use case.
### Creating a Filter
To create a filter, follow these steps:
1. Click **Add Filter**.
2. In the column dropdown, choose the column that you want to filter.
3. In the condition dropdown, choose the filtering condition. The available conditions depend on the data type of the column you selected. For example, a numeric column has the condition **Less Than or Equal To**, whereas a string column has **Contains**.
4. Enter a value in the value field. If the condition does not require a value (for example, **Is Null**), the value field is not shown.
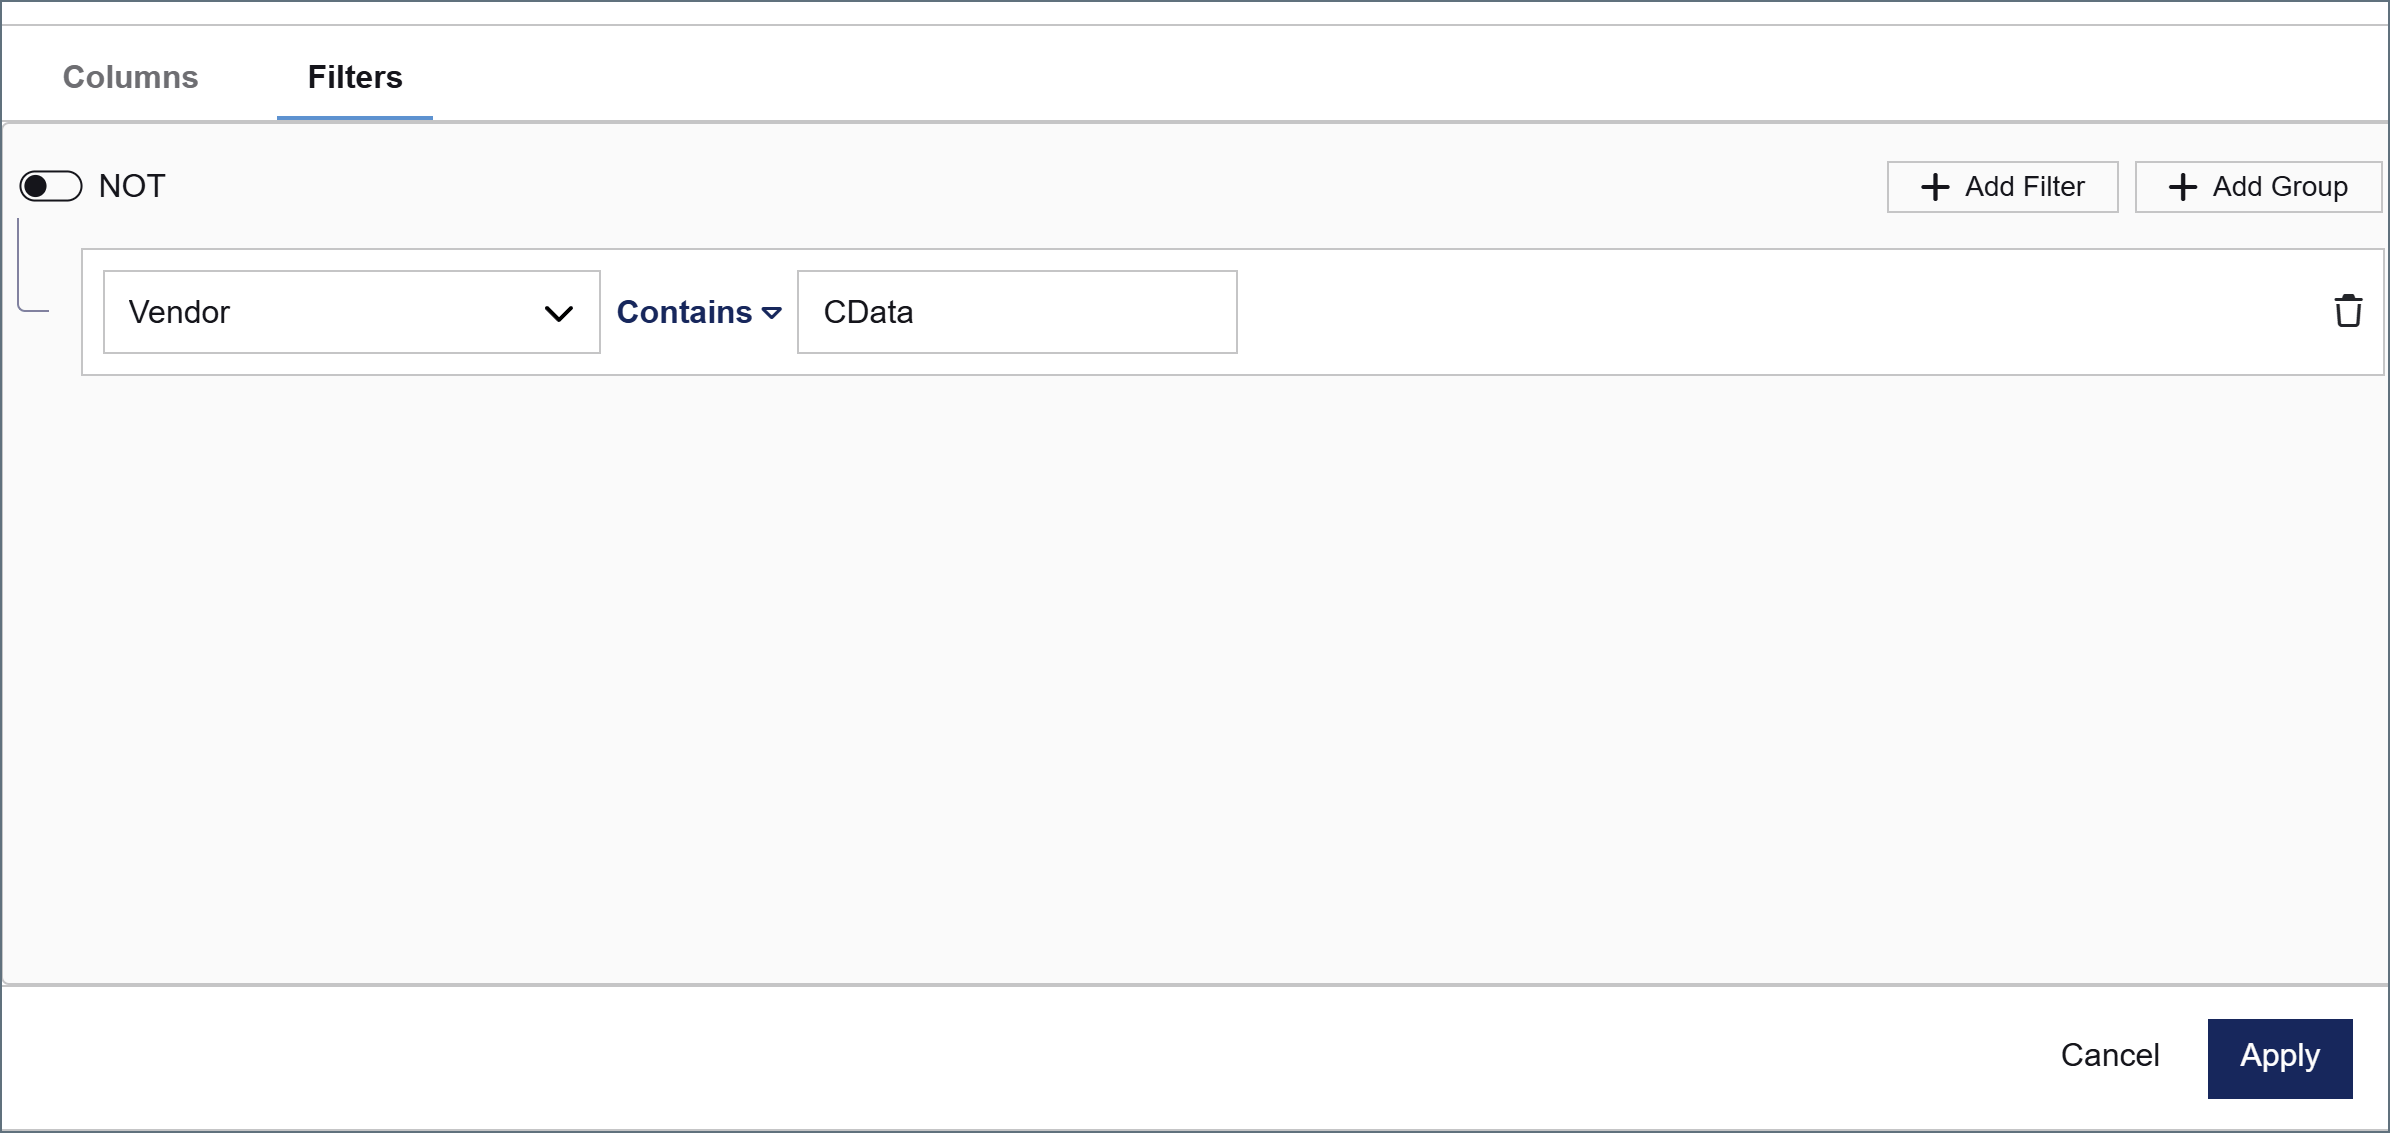
The image below shows an example of a filter on a column named **Vendor**. With this filter in place, the connector only selects rows where the **Vendor** column contains **CData**.
In the **Columns** tab, all columns from all joined tables are listed. Each column displays a tag indicating its source table. By default, all columns are selected. Uncheck a column to exclude it from the query output.
When two joined tables share a column name, the connector automatically prefixes the duplicate column with its table name to avoid collisions.
At the bottom of the **Columns** tab, use the **Order by** field to sort the output by a column, and choose **ASC** (ascending) or **DESC** (descending) order.
The **Filters** tab lets you add filters to limit the rows the connector selects. See [Filters](#filters) for more information.
### Options
The **Options** panel on the right side of the **Edit Source Structure** dialog contains settings that control how the connector processes records.
* **Use column \[x] for processing new or changed records**: Enables incremental processing so that the connector only selects rows that are new or changed since the last run. In a Joined Tables configuration, this column must come from the base (leftmost) table. Columns from joined tables are not available for this setting.
* **Update \[column] with \[value] when rows are processed**: Updates a column with a specified value after each row is processed.
You can also preview the output structure or view the underlying XML configuration by toggling **Preview XML** or **Code View** at the top of the **Edit Source Structure** dialog.
## Filters
You can optionally add filters to limit the data the connector selects. In the settings dialog, click the **Filters** tab to configure filters.
You do not need to apply a filter to your data if it does not suit your use case.
### Creating a Filter
To create a filter, follow these steps:
1. Click **Add Filter**.
2. In the column dropdown, choose the column that you want to filter.
3. In the condition dropdown, choose the filtering condition. The available conditions depend on the data type of the column you selected. For example, a numeric column has the condition **Less Than or Equal To**, whereas a string column has **Contains**.
4. Enter a value in the value field. If the condition does not require a value (for example, **Is Null**), the value field is not shown.
The image below shows an example of a filter on a column named **Vendor**. With this filter in place, the connector only selects rows where the **Vendor** column contains **CData**.
 ### Filter Groups
You can apply multiple filters by clicking **Add Filter** and creating more filters. All filters belong to the same group by default. Click **Add Group** to create a nested group and separate filters by different logic.
Each group has the following options at the top:
* **NOT** toggle: Inverts the logic of the entire group. For example, toggling NOT on a group that contains **Amount Less Than or Equal To 5000** instructs the connector to select only rows where the amount is greater than 5000.
* **And / Or** toggle: Determines how this group relates to adjacent filters or groups.
* If you select **And**, this group's condition must be true in addition to adjacent conditions.
* If you select **Or**, this group's condition is an alternative to adjacent conditions.
The screenshot below shows an example with multiple filter groups.
### Filter Groups
You can apply multiple filters by clicking **Add Filter** and creating more filters. All filters belong to the same group by default. Click **Add Group** to create a nested group and separate filters by different logic.
Each group has the following options at the top:
* **NOT** toggle: Inverts the logic of the entire group. For example, toggling NOT on a group that contains **Amount Less Than or Equal To 5000** instructs the connector to select only rows where the amount is greater than 5000.
* **And / Or** toggle: Determines how this group relates to adjacent filters or groups.
* If you select **And**, this group's condition must be true in addition to adjacent conditions.
* If you select **Or**, this group's condition is an alternative to adjacent conditions.
The screenshot below shows an example with multiple filter groups.
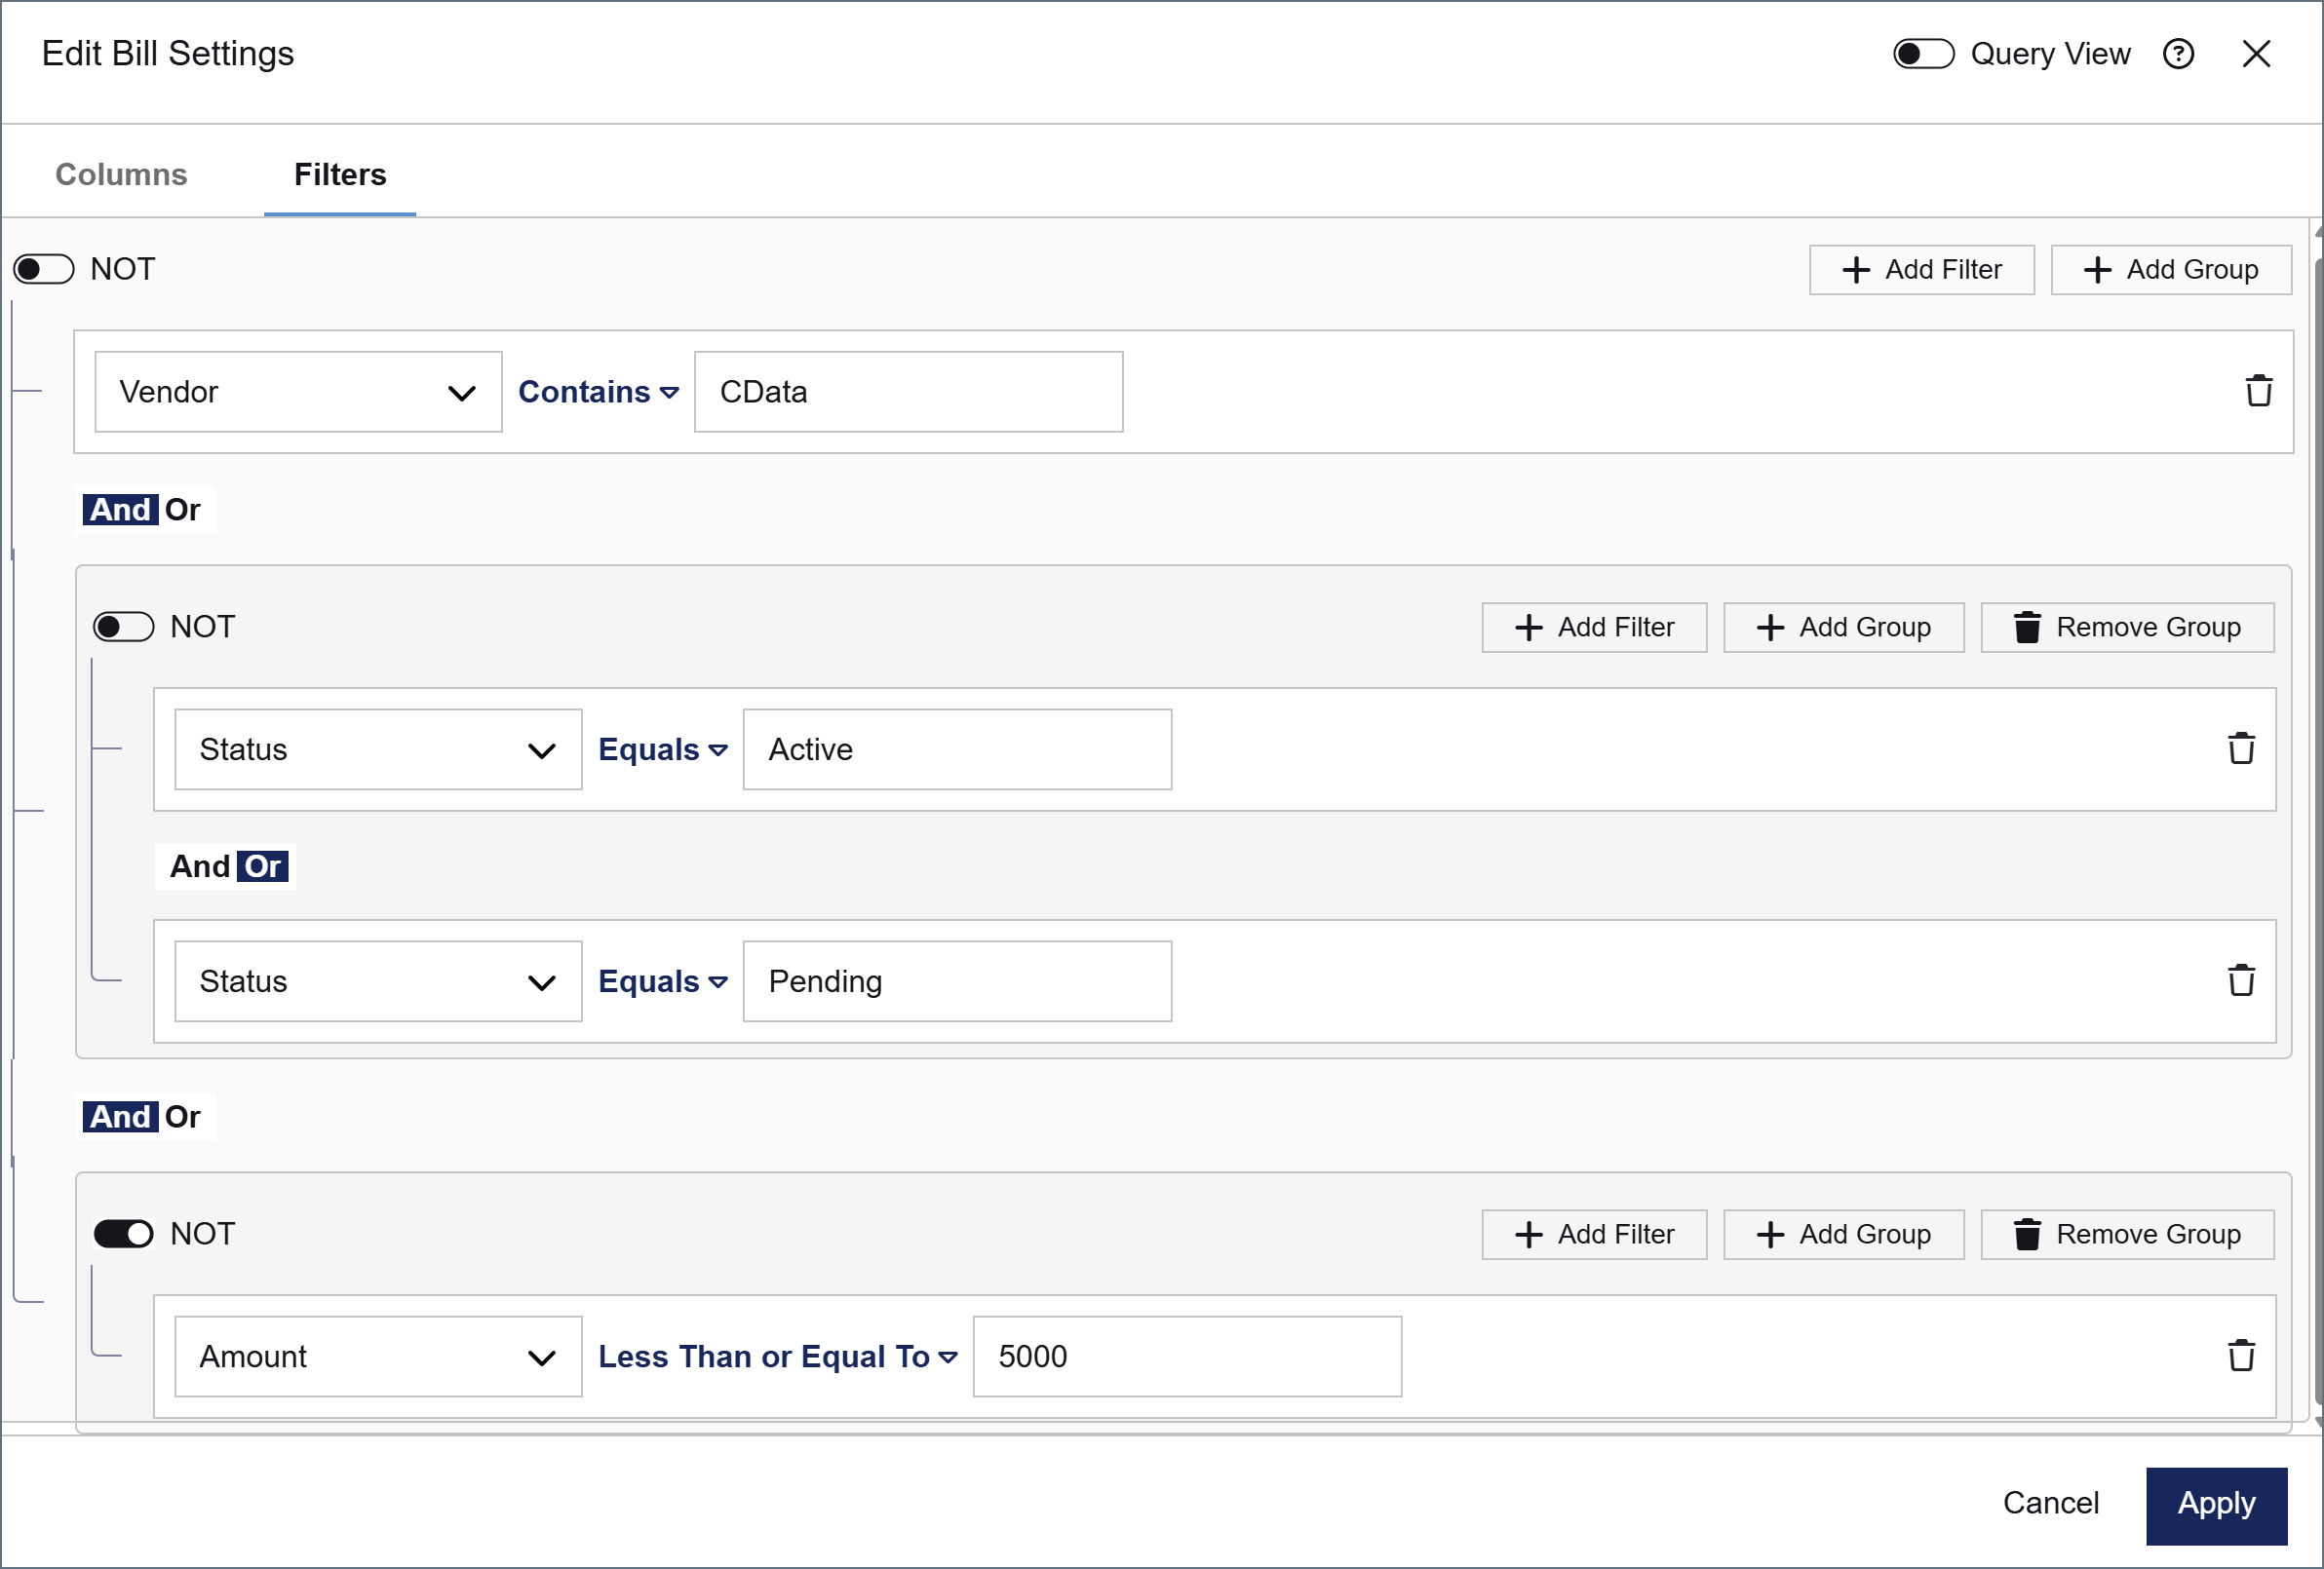 In this example, the filter condition is met when all of the following are true:
* The **Vendor** column contains **CData**
* The **Status** column equals **Active** or **Pending**
* The **Amount** column is *not* less than or equal to **5000** (that is, Amount is greater than 5000)
If this filter condition is met, the connector selects the matching data and passes it into the mapping.
### Using Query View
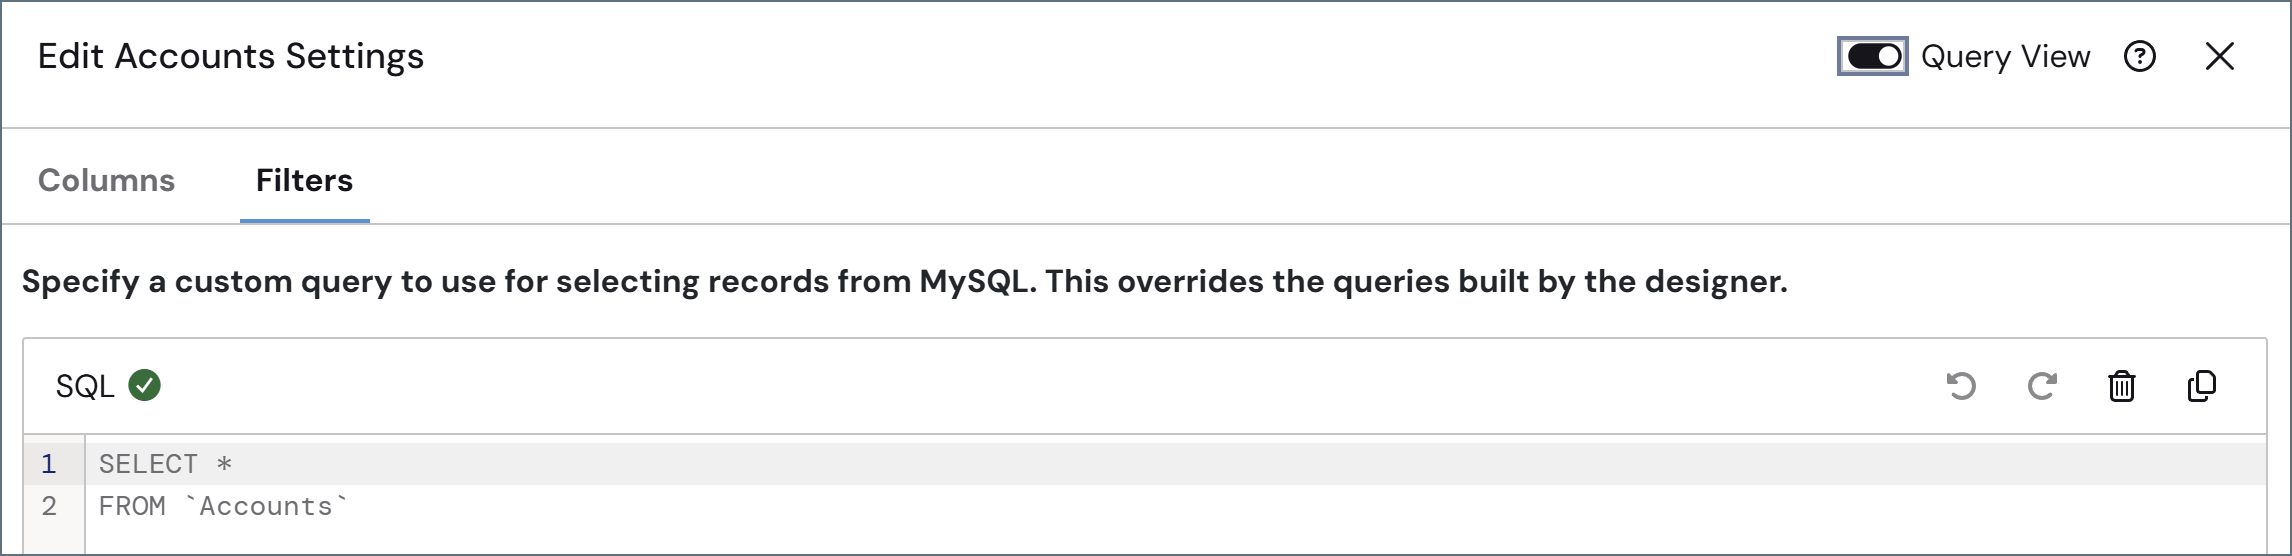
Toggle on **Query View** to write a custom SQL query that selects data from your data source. This overrides any queries created in the designer.
In this example, the filter condition is met when all of the following are true:
* The **Vendor** column contains **CData**
* The **Status** column equals **Active** or **Pending**
* The **Amount** column is *not* less than or equal to **5000** (that is, Amount is greater than 5000)
If this filter condition is met, the connector selects the matching data and passes it into the mapping.
### Using Query View
Toggle on **Query View** to write a custom SQL query that selects data from your data source. This overrides any queries created in the designer.