> ## Documentation Index
> Fetch the complete documentation index at: https://docs.arc.cdata.com/llms.txt
> Use this file to discover all available pages before exploring further.
# Partner Dashboard
> View key metrics and recent messages for a trading partner in the CData Arc TPMC.
Each trading partner has its own dashboard, which is the EDI **Partners** landing page. By default, it displays metrics for the last 7 days, but you can use the **Show data for** dropdown to select your preferred time period. The options are:
* Today
* Past 24 hours
* Past 3 days
* Past 7 days
* Past 30 days
* Past 3 months
* Past 12 months
The time periods shown vary based on your [cleanup interval settings](../getting-started/administration/settings/cleanup-settings), so you might not see all of the time periods listed above.
The dashboard is divided into a number of sections, each of which is covered below. The dashboard is user-specific, so you can customize it to fit your needs by using the **Edit** button near the top of the page, or the **Edit** links on certain cards.
## Key Metrics
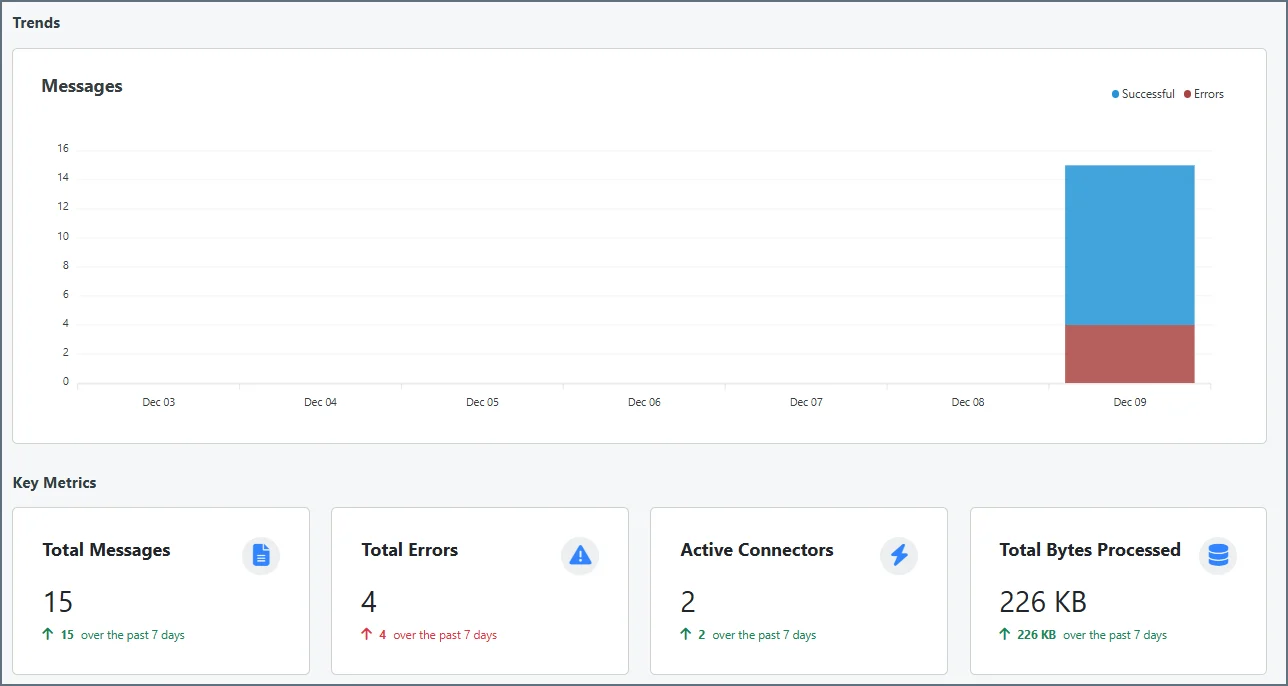 You can display between two and eight metrics that provide a view into your TPMC partner's health, volume, and usage. To pick your metrics, click the **Edit** button, then click the **Edit** link in the Key Metrics section. Choose from the following list:
* Total Messages
* Total Transactions
* Total Transactions Sent
* Total Transactions Received
* Total MFT Transactions
* Total EDI Messages
* Total Errors
* Total Send Errors
* Total Receive Errors
* Total Connectors
* Active Connectors
* Total Workspaces
* Active Workspaces
* Total Bytes Processed
* Average Bytes Processed
* Average Processing Time
* Success Rate
* Failure Rate
* SLA Violations
* At Risk SLAs
## Recent Messages
You can display between two and eight metrics that provide a view into your TPMC partner's health, volume, and usage. To pick your metrics, click the **Edit** button, then click the **Edit** link in the Key Metrics section. Choose from the following list:
* Total Messages
* Total Transactions
* Total Transactions Sent
* Total Transactions Received
* Total MFT Transactions
* Total EDI Messages
* Total Errors
* Total Send Errors
* Total Receive Errors
* Total Connectors
* Active Connectors
* Total Workspaces
* Active Workspaces
* Total Bytes Processed
* Average Bytes Processed
* Average Processing Time
* Success Rate
* Failure Rate
* SLA Violations
* At Risk SLAs
## Recent Messages
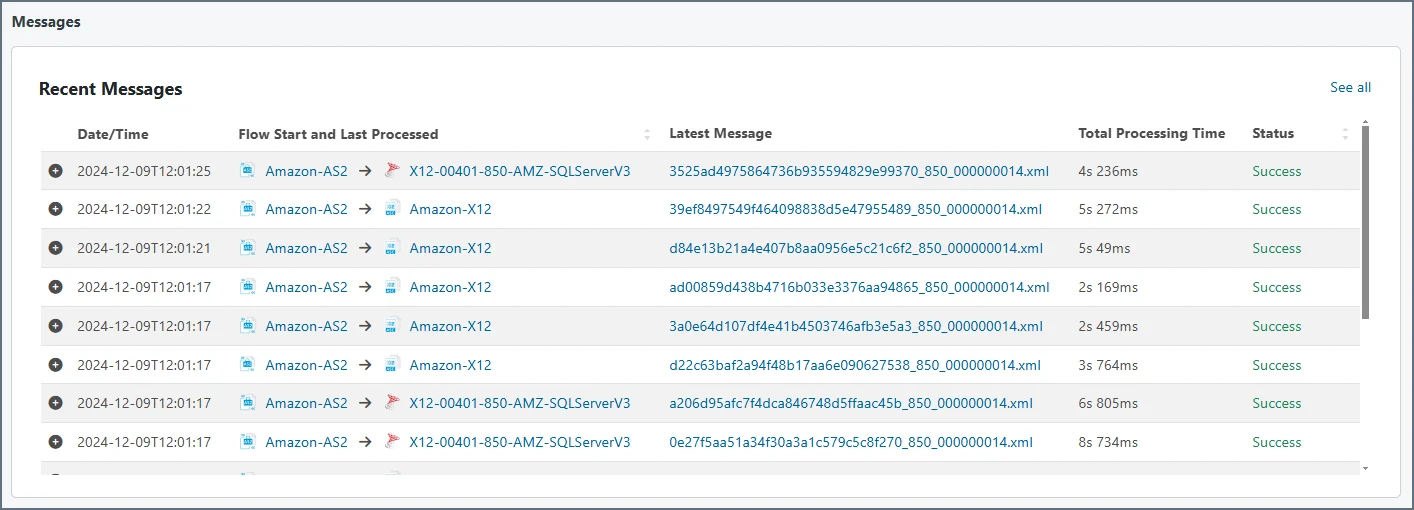 This is a simplified view of what you see on the **Activity > Messages** tab. It displays the 25 most recent messages. Click the **See all** link to go to the Messages tab and view the full list. See [Messages Tab](../getting-started/administration/activity#messages-tab) for details.